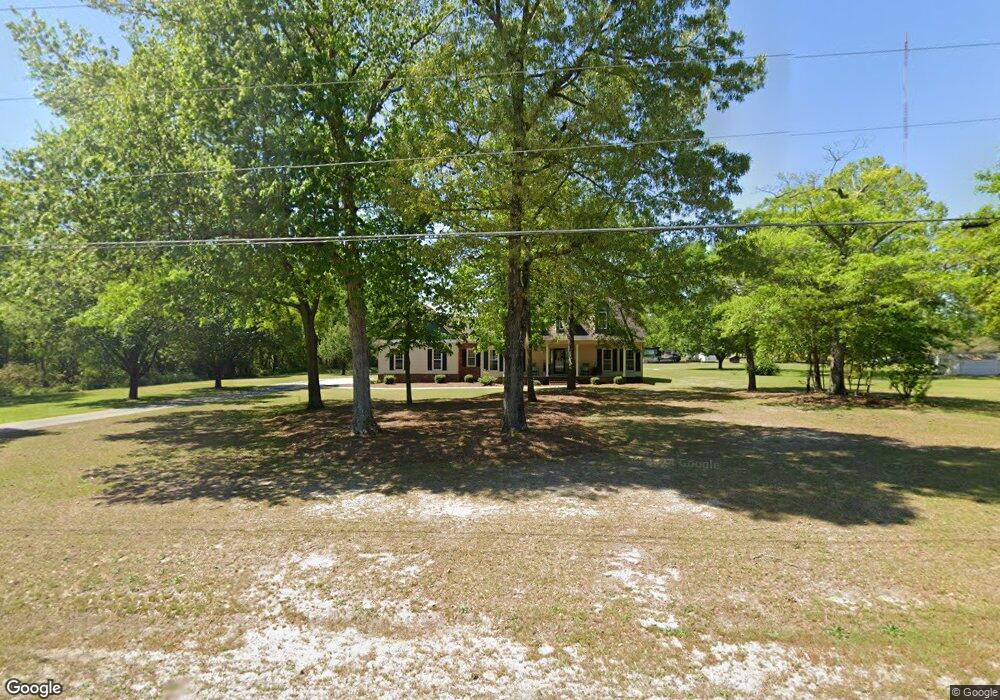
124 E Main St Lumber Bridge, NC 28357
Estimated Value: $296,000 - $351,000
3
Beds
2
Baths
3,123
Sq Ft
$107/Sq Ft
Est. Value
About This Home
This home is located at 124 E Main St, Lumber Bridge, NC 28357 and is currently estimated at $334,984, approximately $107 per square foot. 124 E Main St is a home located in Robeson County with nearby schools including Parkton Elementary School, Rex-Rennert Elementary School, and Saint Pauls Middle School.
Create a Home Valuation Report for This Property
The Home Valuation Report is an in-depth analysis detailing your home's value as well as a comparison with similar homes in the area
Home Values in the Area
Average Home Value in this Area
Tax History
| Year | Tax Paid | Tax Assessment Tax Assessment Total Assessment is a certain percentage of the fair market value that is determined by local assessors to be the total taxable value of land and additions on the property. | Land | Improvement |
|---|---|---|---|---|
| 2025 | $3,774 | $335,800 | $7,600 | $328,200 |
| 2024 | $3,769 | $335,800 | $7,600 | $328,200 |
| 2023 | $3,045 | $270,700 | $6,900 | $263,800 |
| 2022 | $3,045 | $270,700 | $6,900 | $263,800 |
| 2021 | $3,045 | $270,700 | $6,900 | $263,800 |
| 2020 | $3,030 | $250,700 | $6,900 | $243,800 |
| 2018 | $3,092 | $233,600 | $7,100 | $226,500 |
| 2017 | $2,676 | $233,600 | $7,100 | $226,500 |
| 2016 | $2,676 | $233,600 | $7,100 | $226,500 |
| 2015 | $2,676 | $233,600 | $7,100 | $226,500 |
| 2014 | $2,676 | $233,600 | $7,100 | $226,500 |
Source: Public Records
Map
Nearby Homes
- NC HWY 71 N Carolina 71
- 74 Dalton Dr
- 105 School St
- 26 Chariot Cir
- 19 Chariot Cir
- 18 Chariot Cir
- 27 Chariot Cir
- 34 Chariot Cir
- 106 Aquarian Dr
- 702 McGougan Rd
- 162 Schmidt Ln
- 1112 McNeill Pond Rd
- 214 Dalton Dr
- 232 Dalton Dr
- 214 Dalton (Lot 4) Dr
- 473 Costner Rd
- 0 Costner Rd Unit 755160
- 12305 Rennert Rd
- 158 Acadiana Dr
- 8372 Saint Pauls Dr
Your Personal Tour Guide
Ask me questions while you tour the home.