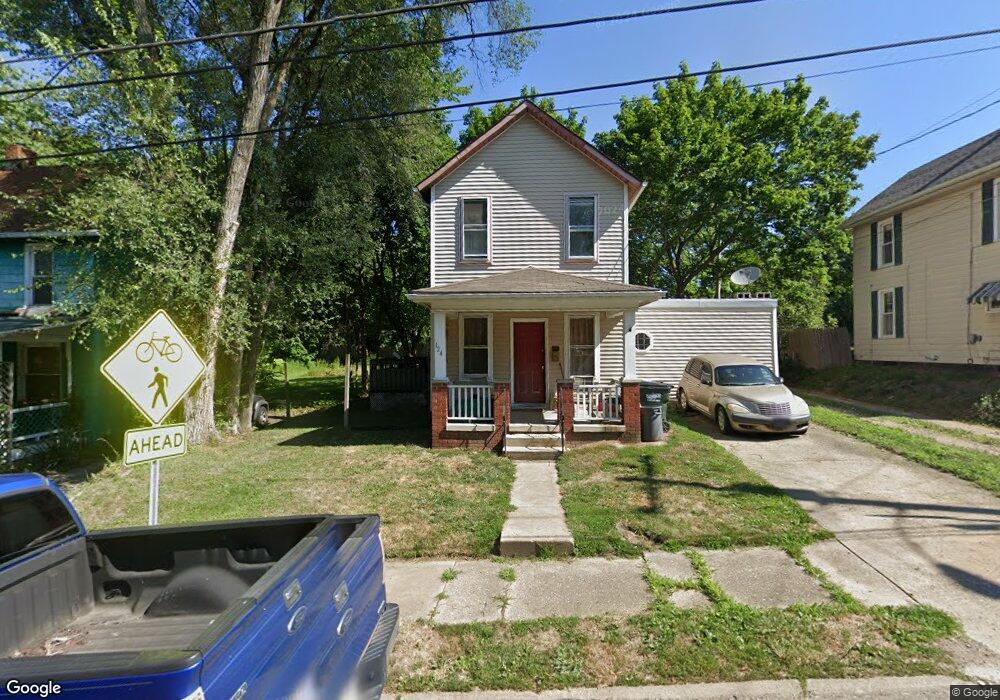
124 E Summit St Alliance, OH 44601
Estimated Value: $75,768 - $111,000
2
Beds
1
Bath
772
Sq Ft
$115/Sq Ft
Est. Value
About This Home
This home is located at 124 E Summit St, Alliance, OH 44601 and is currently estimated at $88,942, approximately $115 per square foot. 124 E Summit St is a home located in Stark County with nearby schools including Alliance Intermediate School at Northside, Alliance Elementary School at Rockhill, and Alliance Middle School.
Ownership History
Date
Name
Owned For
Owner Type
Purchase Details
Closed on
Jan 25, 2017
Sold by
Caldwell Charles
Bought by
Stark County Land Reutilization Corp
Current Estimated Value
Purchase Details
Closed on
Jun 12, 2014
Sold by
Cugini Kristy M and Cugini Justin A
Bought by
Sihock Henry
Purchase Details
Closed on
Apr 27, 2007
Sold by
Betts Kristy M
Bought by
Betts Kristy M and Cugini Justin A
Purchase Details
Closed on
Jun 21, 2006
Sold by
Justice Joseph L and Justice Rita
Bought by
Betts Kristy M
Purchase Details
Closed on
Jun 1, 2000
Sold by
Bichsel Mark S
Bought by
Justice Joseph L and Justice Rita
Purchase Details
Closed on
Jan 21, 1999
Sold by
Perez Linda
Bought by
Stillion Clifford A and Stillion Beverly J
Purchase Details
Closed on
Jul 9, 1990
Create a Home Valuation Report for This Property
The Home Valuation Report is an in-depth analysis detailing your home's value as well as a comparison with similar homes in the area
Home Values in the Area
Average Home Value in this Area
Purchase History
| Date | Buyer | Sale Price | Title Company |
|---|---|---|---|
| Stark County Land Reutilization Corp | -- | None Available | |
| Sihock Henry | $4,700 | None Available | |
| Betts Kristy M | -- | None Available | |
| Betts Kristy M | $2,500 | None Available | |
| Justice Joseph L | $12,700 | -- | |
| Stillion Clifford A | $5,500 | -- | |
| -- | $20,000 | -- |
Source: Public Records
Tax History
| Year | Tax Paid | Tax Assessment Tax Assessment Total Assessment is a certain percentage of the fair market value that is determined by local assessors to be the total taxable value of land and additions on the property. | Land | Improvement |
|---|---|---|---|---|
| 2025 | $971 | $19,960 | $3,190 | $16,770 |
| 2024 | $312 | $19,960 | $3,190 | $16,770 |
| 2023 | $604 | $13,340 | $1,750 | $11,590 |
| 2022 | $553 | $13,340 | $1,750 | $11,590 |
| 2021 | $554 | $13,340 | $1,750 | $11,590 |
| 2020 | $484 | $10,890 | $1,510 | $9,380 |
| 2019 | $478 | $10,890 | $1,510 | $9,380 |
| 2018 | $480 | $10,890 | $1,510 | $9,380 |
| 2017 | $430 | $9,590 | $1,260 | $8,330 |
| 2016 | $434 | $9,590 | $1,260 | $8,330 |
| 2015 | $219 | $9,590 | $1,260 | $8,330 |
| 2014 | $235 | $5,040 | $1,120 | $3,920 |
| 2013 | $369 | $5,040 | $1,120 | $3,920 |
Source: Public Records
Map
Nearby Homes
- 807 S Union Ave
- 726 S Arch Ave
- 0 E Oxford St
- 46 Rosenberry St
- 427 S Union Ave
- 234 Rosenberry St
- 62 E High St
- 231 Rosenberry St
- 226 Milner St
- 452 E Summit St
- 134 11th St
- 167 11th St
- 203 Glamorgan St
- 621 S Haines Ave
- 228 W Oxford St
- V/L S Freedom Ave
- 62 E Market St
- 442 S Liberty Ave
- 361 E Main St
- 163 W Market St
- 124 E Summit St
- 123 E Summit St
- 114 E Summit St
- 146 E Summit St
- 133 E Summit St
- 154 E Summit St
- 143 E Summit St
- 661 Summit Ct
- 681 S Mechanic Ave
- 709 S Mechanic Ave
- 651 Summit Ct
- 691 S Mechanic Ave
- 669 S Mechanic Ave
- 729 S Mechanic Ave
- 61 E Summit St
- 657 S Mechanic Ave
- 144 E Grant St
- 641 Summit Ct
- 54 Auburn Place
- 725 S Mechanic Ave
Your Personal Tour Guide
Ask me questions while you tour the home.