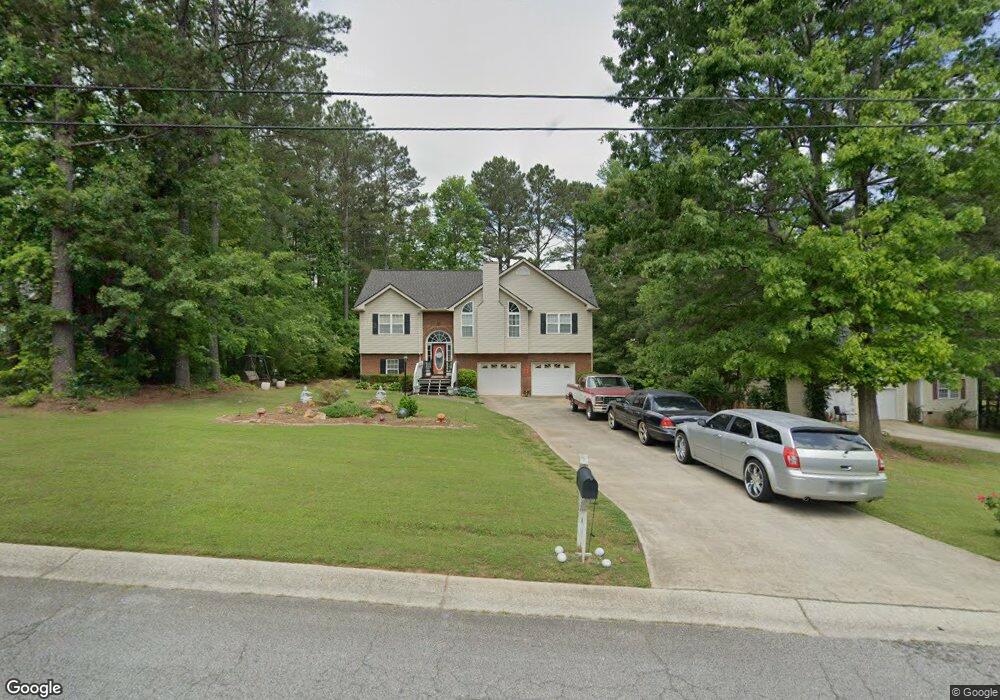
124 Eagles Nest Cir Unit 94 Carrollton, GA 30116
Estimated Value: $272,000 - $292,075
5
Beds
3
Baths
1,400
Sq Ft
$201/Sq Ft
Est. Value
About This Home
This home is located at 124 Eagles Nest Cir Unit 94, Carrollton, GA 30116 and is currently estimated at $281,019, approximately $200 per square foot. 124 Eagles Nest Cir Unit 94 is a home located in Carroll County with nearby schools including Central Elementary School, Central Middle School, and Central High School.
Ownership History
Date
Name
Owned For
Owner Type
Purchase Details
Closed on
Dec 3, 2015
Sold by
Crandell Joshua
Bought by
Horton Jesse
Current Estimated Value
Home Financials for this Owner
Home Financials are based on the most recent Mortgage that was taken out on this home.
Original Mortgage
$114,000
Outstanding Balance
$90,275
Interest Rate
3.91%
Mortgage Type
New Conventional
Estimated Equity
$190,744
Purchase Details
Closed on
Mar 22, 2010
Sold by
Kendrick Chastaine P
Bought by
Crandell Joshua
Home Financials for this Owner
Home Financials are based on the most recent Mortgage that was taken out on this home.
Original Mortgage
$116,844
Interest Rate
5.5%
Mortgage Type
FHA
Purchase Details
Closed on
Jul 13, 1999
Sold by
Orl Properties Inc
Bought by
Kendrick Chastaine P
Purchase Details
Closed on
Nov 23, 1998
Sold by
Mcdowell Dennis H
Bought by
Orl Properties Inc
Purchase Details
Closed on
Mar 20, 1998
Bought by
Mcdowell Dennis H
Create a Home Valuation Report for This Property
The Home Valuation Report is an in-depth analysis detailing your home's value as well as a comparison with similar homes in the area
Home Values in the Area
Average Home Value in this Area
Purchase History
| Date | Buyer | Sale Price | Title Company |
|---|---|---|---|
| Horton Jesse | $120,000 | -- | |
| Crandell Joshua | $119,000 | -- | |
| Kendrick Chastaine P | $129,200 | -- | |
| Orl Properties Inc | $13,800 | -- | |
| Mcdowell Dennis H | -- | -- |
Source: Public Records
Mortgage History
| Date | Status | Borrower | Loan Amount |
|---|---|---|---|
| Open | Horton Jesse | $114,000 | |
| Previous Owner | Crandell Joshua | $116,844 |
Source: Public Records
Tax History Compared to Growth
Tax History
| Year | Tax Paid | Tax Assessment Tax Assessment Total Assessment is a certain percentage of the fair market value that is determined by local assessors to be the total taxable value of land and additions on the property. | Land | Improvement |
|---|---|---|---|---|
| 2024 | $2,577 | $120,772 | $7,400 | $113,372 |
| 2023 | $2,577 | $110,553 | $7,400 | $103,153 |
| 2022 | $2,228 | $88,837 | $6,000 | $82,837 |
| 2021 | $1,974 | $76,991 | $6,000 | $70,991 |
| 2020 | $1,571 | $61,194 | $6,000 | $55,194 |
| 2019 | $1,479 | $57,170 | $6,000 | $51,170 |
| 2018 | $1,292 | $49,215 | $4,000 | $45,215 |
| 2017 | $1,296 | $49,215 | $4,000 | $45,215 |
| 2016 | $1,265 | $49,215 | $4,000 | $45,215 |
| 2015 | $1,112 | $39,776 | $4,000 | $35,776 |
| 2014 | $966 | $34,410 | $4,000 | $30,410 |
Source: Public Records
Map
Nearby Homes
- 124 Eagles Nest Cir
- 136 Eagles Nest Cir
- 112 Eagles Nest Cir
- 148 Eagles Nest Cir
- 104 Eagles Nest Cir
- 448 Eagles Nest Cir
- 460 Eagles Nest Cir
- 430 Eagles Nest Cir
- 125 Eagles Nest Cir
- 105 Eagles Nest Cir
- 145 Eagles Nest Cir
- 472 Eagles Nest Cir
- 424 Eagles Nest Cir
- 166 Eagles Nest Cir
- 100 Eagles Nest Cir
- 165 Eagles Nest Cir
- 490 Eagles Nest Cir
- 412 Eagles Nest Cir
- 184 Eagles Nest Cir
- 1450 Eagles Nest Cir