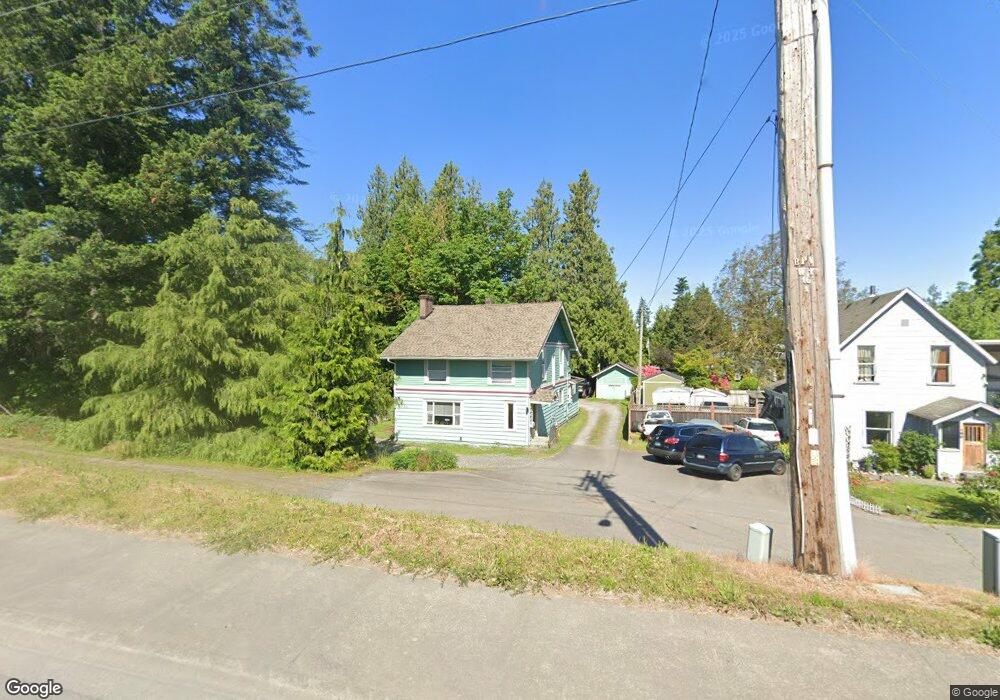
124 Everson Rd Everson, WA 98247
Estimated Value: $427,000 - $533,000
4
Beds
2
Baths
2,210
Sq Ft
$212/Sq Ft
Est. Value
About This Home
This home is located at 124 Everson Rd, Everson, WA 98247 and is currently estimated at $468,888, approximately $212 per square foot. 124 Everson Rd is a home located in Whatcom County with nearby schools including Everson Elementary School, Nooksack Elementary School, and Sumas Elementary School.
Ownership History
Date
Name
Owned For
Owner Type
Purchase Details
Closed on
Feb 22, 2012
Sold by
Shadbolt Bart and Shadbolt Melisa
Bought by
Craft George B and Hoyt Gretchen R
Current Estimated Value
Purchase Details
Closed on
Aug 29, 2003
Sold by
Shadbolt Jack E
Bought by
Shadbolt Bartley and Shadbolt Melisa A
Home Financials for this Owner
Home Financials are based on the most recent Mortgage that was taken out on this home.
Original Mortgage
$126,000
Interest Rate
4.12%
Mortgage Type
New Conventional
Purchase Details
Closed on
Jul 31, 2003
Sold by
Shadbolt Anthony
Bought by
Shadbolt Bart and Shadbolt Melisa
Home Financials for this Owner
Home Financials are based on the most recent Mortgage that was taken out on this home.
Original Mortgage
$126,000
Interest Rate
4.12%
Mortgage Type
New Conventional
Create a Home Valuation Report for This Property
The Home Valuation Report is an in-depth analysis detailing your home's value as well as a comparison with similar homes in the area
Home Values in the Area
Average Home Value in this Area
Purchase History
| Date | Buyer | Sale Price | Title Company |
|---|---|---|---|
| Craft George B | $122,280 | Whatcom Land Title | |
| Shadbolt Bartley | -- | Stewart Title Company | |
| Shadbolt Bart | -- | -- |
Source: Public Records
Mortgage History
| Date | Status | Borrower | Loan Amount |
|---|---|---|---|
| Previous Owner | Shadbolt Bartley | $126,000 | |
| Previous Owner | Shadbolt Bart | $90,000 |
Source: Public Records
Tax History
| Year | Tax Paid | Tax Assessment Tax Assessment Total Assessment is a certain percentage of the fair market value that is determined by local assessors to be the total taxable value of land and additions on the property. | Land | Improvement |
|---|---|---|---|---|
| 2025 | $4,246 | $468,519 | $244,530 | $223,989 |
| 2024 | $2,823 | $452,526 | $234,000 | $218,526 |
| 2023 | $2,823 | $306,222 | $120,526 | $185,696 |
| 2022 | $2,586 | $275,881 | $108,584 | $167,297 |
| 2021 | $2,395 | $228,004 | $89,740 | $138,264 |
| 2020 | $2,302 | $185,373 | $72,961 | $112,412 |
| 2019 | $1,960 | $185,373 | $72,961 | $112,412 |
| 2018 | $2,338 | $177,850 | $70,000 | $107,850 |
| 2017 | $2,097 | $160,620 | $58,000 | $102,620 |
| 2016 | $2,007 | $148,213 | $53,500 | $94,713 |
| 2015 | $1,708 | $142,272 | $51,600 | $90,672 |
| 2014 | -- | $137,860 | $50,000 | $87,860 |
| 2013 | -- | $137,860 | $50,000 | $87,860 |
Source: Public Records
Map
Nearby Homes
- 0 Walnut Grove Ct
- 408 W 3rd St
- 416 W 3rd St
- 107 River St
- 409 W 4th St
- 108 Baker St Unit 1-4
- 207 E Main St
- 702 N Washington St
- 616 Strandell St
- 107 Thendara Park Dr Unit C
- 109 W 2nd St
- 304 W 3rd St
- 308 W 3rd St
- 404 W 3rd St
- 412 W 3rd St
- 800 Cedar Dr
- 809 Pine Crest Dr
- 1005 Night Hawk Way
- 7554 Nooksack Rd
- 303 Hayes St
- 120 Everson Rd
- 413 W Main St
- 407 W Main St
- 111 Everson Rd
- 412 W Main St
- 408 W Main St
- 402 W Main St
- 406 W Main St
- 106 Everson Rd
- 106 Park Dr
- 0 Xx Trapline Rd
- 314 W Main St
- 312 W Main St
- 316 Everson Rd Unit D
- 403 W 1st St
- 203 Walnut Grove Ct Unit 203-B
- 203 Walnut Grove Ct Unit 203-A
- 203 Walnut Grove Ct Unit 110
- 207 Walnut Grove Ct Unit 207-B
Your Personal Tour Guide
Ask me questions while you tour the home.