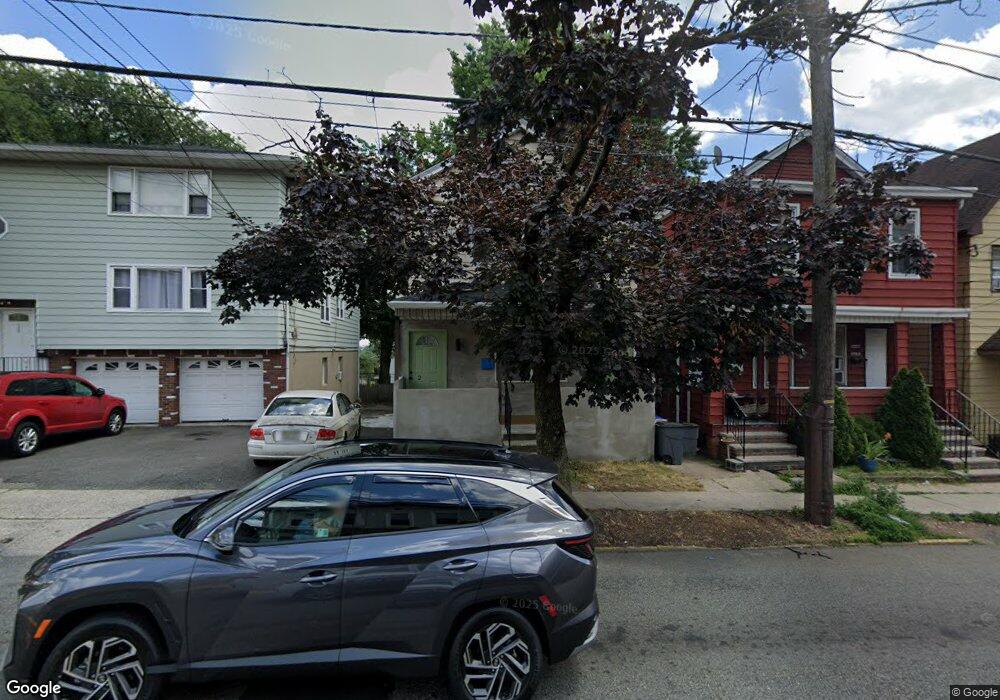
124 Hackensack St Unit 2 East Rutherford, NJ 07073
Estimated Value: $541,000 - $618,697
2
Beds
2
Baths
850
Sq Ft
$672/Sq Ft
Est. Value
About This Home
This home is located at 124 Hackensack St Unit 2, East Rutherford, NJ 07073 and is currently estimated at $571,174, approximately $671 per square foot. 124 Hackensack St Unit 2 is a home located in Bergen County with nearby schools including Mckenzie School, Alfred Faust School, and Henry P Becton Regional High School.
Ownership History
Date
Name
Owned For
Owner Type
Purchase Details
Closed on
Aug 6, 2024
Sold by
Staggers Lucila N
Bought by
Kinaci Volkan
Current Estimated Value
Home Financials for this Owner
Home Financials are based on the most recent Mortgage that was taken out on this home.
Original Mortgage
$494,000
Outstanding Balance
$488,495
Interest Rate
6.95%
Mortgage Type
New Conventional
Estimated Equity
$82,679
Purchase Details
Closed on
Mar 9, 2021
Sold by
U S Bank Trust Na
Bought by
Staggers Lucila N
Purchase Details
Closed on
Nov 30, 2018
Sold by
Us Bank Na
Bought by
Us Bank Na Tr
Purchase Details
Closed on
Jan 17, 2003
Sold by
Turner James F
Bought by
Over Guzide and Over Murat
Home Financials for this Owner
Home Financials are based on the most recent Mortgage that was taken out on this home.
Original Mortgage
$227,563
Interest Rate
5.88%
Mortgage Type
FHA
Create a Home Valuation Report for This Property
The Home Valuation Report is an in-depth analysis detailing your home's value as well as a comparison with similar homes in the area
Home Values in the Area
Average Home Value in this Area
Purchase History
| Date | Buyer | Sale Price | Title Company |
|---|---|---|---|
| Kinaci Volkan | $520,000 | Chicago Title | |
| Kinaci Volkan | $520,000 | Chicago Title | |
| Staggers Lucila N | $324,624 | Coastal Title Agency Inc | |
| Us Bank Na Tr | -- | -- | |
| Over Guzide | $236,000 | -- |
Source: Public Records
Mortgage History
| Date | Status | Borrower | Loan Amount |
|---|---|---|---|
| Open | Kinaci Volkan | $494,000 | |
| Closed | Kinaci Volkan | $494,000 | |
| Previous Owner | Over Guzide | $227,563 |
Source: Public Records
Tax History Compared to Growth
Tax History
| Year | Tax Paid | Tax Assessment Tax Assessment Total Assessment is a certain percentage of the fair market value that is determined by local assessors to be the total taxable value of land and additions on the property. | Land | Improvement |
|---|---|---|---|---|
| 2025 | $6,852 | $468,500 | $250,100 | $218,400 |
| 2024 | $6,586 | $422,700 | $239,200 | $183,500 |
| 2023 | $6,645 | $405,800 | $228,300 | $177,500 |
| 2022 | $6,645 | $379,500 | $208,600 | $170,900 |
| 2021 | $6,340 | $352,800 | $186,800 | $166,000 |
| 2020 | $6,197 | $340,700 | $182,500 | $158,200 |
| 2019 | $6,260 | $341,700 | $179,100 | $162,600 |
| 2018 | $5,370 | $302,000 | $152,400 | $149,600 |
| 2017 | $5,274 | $254,300 | $134,100 | $120,200 |
| 2016 | $4,946 | $254,300 | $134,100 | $120,200 |
| 2015 | $5,002 | $254,300 | $134,100 | $120,200 |
| 2014 | $4,842 | $254,300 | $134,100 | $120,200 |
Source: Public Records
Map
Nearby Homes
- 60 Prospect Terrace
- 233 Paterson Ave
- 451 Hoboken Rd
- 266 Park Ave
- 132 Union Ave Unit 405A
- 426 Broad St
- 344 10th St
- 1 Orient Way Unit 311
- 1 Orient Way Unit 204
- 11 Ayer Place
- 327 Madison St
- 58 Mozart St
- 50 Orient Way
- 522 9th St
- 22 Sylvan St Unit 3B
- 22 Sylvan St
- 409 Washington St
- 120 Chestnut Stunit C
- 133 Mortimer Ave
- 120 Chestnut St
- 124 Hackensack St
- 126 Hackensack St
- 120 Hackensack St
- 128 Hackensack St
- 116 Hackensack St
- 123 Cornelia St
- 125 Cornelia St
- 127 Cornelia St
- 129 Cornelia St
- 130 Hackensack St
- 119 Cornelia St
- 131 Cornelia St
- 125 Hackensack St
- 109 Cornelia St
- 184 Paterson Ave
- 105 Cornelia St
- 110 Hackensack St
- 196 Paterson Ave
- 115 Ann St
- 140 Hackensack St