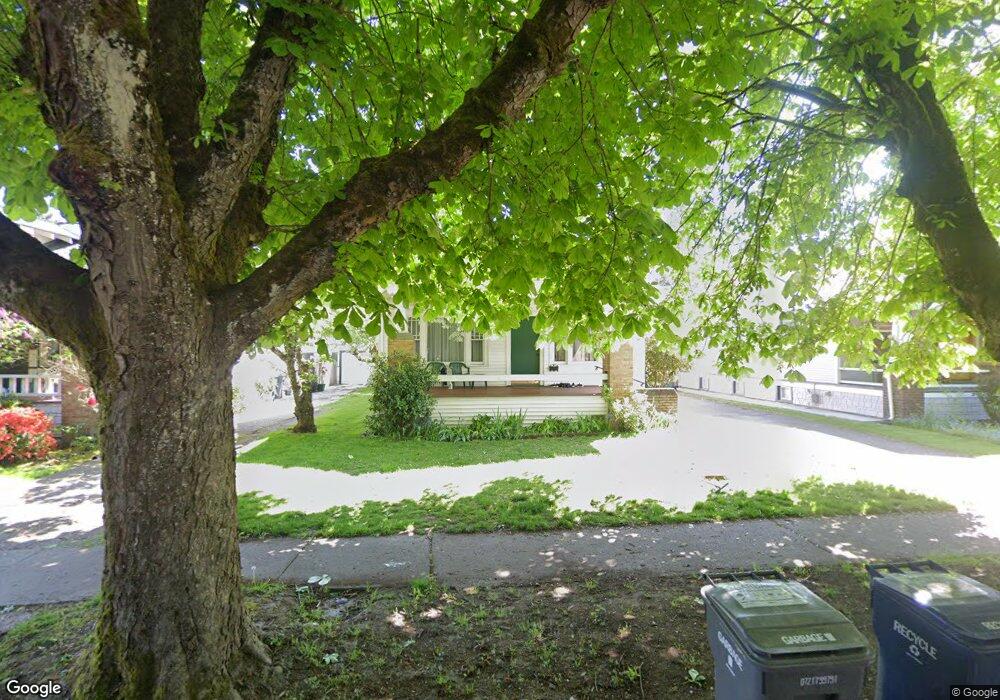
124 I St SE Auburn, WA 98002
Downtown Auburn NeighborhoodEstimated Value: $416,000 - $457,000
2
Beds
1
Bath
1,050
Sq Ft
$416/Sq Ft
Est. Value
About This Home
This home is located at 124 I St SE, Auburn, WA 98002 and is currently estimated at $437,021, approximately $416 per square foot. 124 I St SE is a home located in King County with nearby schools including Washington Elementary School, Cascade Middle School, and Auburn High School.
Ownership History
Date
Name
Owned For
Owner Type
Purchase Details
Closed on
May 4, 2000
Sold by
Carson Paul N
Bought by
Carson Elizabeth D
Current Estimated Value
Purchase Details
Closed on
Feb 28, 2000
Sold by
Morley Daniel R
Bought by
Raab Andrew L and Flynn Raab Megan K
Home Financials for this Owner
Home Financials are based on the most recent Mortgage that was taken out on this home.
Original Mortgage
$129,000
Outstanding Balance
$43,310
Interest Rate
8.16%
Estimated Equity
$393,711
Create a Home Valuation Report for This Property
The Home Valuation Report is an in-depth analysis detailing your home's value as well as a comparison with similar homes in the area
Home Values in the Area
Average Home Value in this Area
Purchase History
| Date | Buyer | Sale Price | Title Company |
|---|---|---|---|
| Carson Elizabeth D | -- | -- | |
| Raab Andrew L | $133,000 | Fidelity National Title |
Source: Public Records
Mortgage History
| Date | Status | Borrower | Loan Amount |
|---|---|---|---|
| Open | Raab Andrew L | $129,000 |
Source: Public Records
Tax History Compared to Growth
Tax History
| Year | Tax Paid | Tax Assessment Tax Assessment Total Assessment is a certain percentage of the fair market value that is determined by local assessors to be the total taxable value of land and additions on the property. | Land | Improvement |
|---|---|---|---|---|
| 2024 | $5,392 | $445,000 | $117,000 | $328,000 |
| 2023 | $4,930 | $391,000 | $94,000 | $297,000 |
| 2022 | $4,421 | $409,000 | $102,000 | $307,000 |
| 2021 | $4,255 | $325,000 | $82,000 | $243,000 |
| 2020 | $3,895 | $296,000 | $77,000 | $219,000 |
| 2018 | $3,749 | $263,000 | $75,000 | $188,000 |
| 2017 | $3,384 | $233,000 | $69,000 | $164,000 |
| 2016 | $2,983 | $210,000 | $66,000 | $144,000 |
| 2015 | $2,948 | $196,000 | $61,000 | $135,000 |
| 2014 | -- | $188,000 | $58,000 | $130,000 |
| 2013 | -- | $144,000 | $53,000 | $91,000 |
Source: Public Records
Map
Nearby Homes