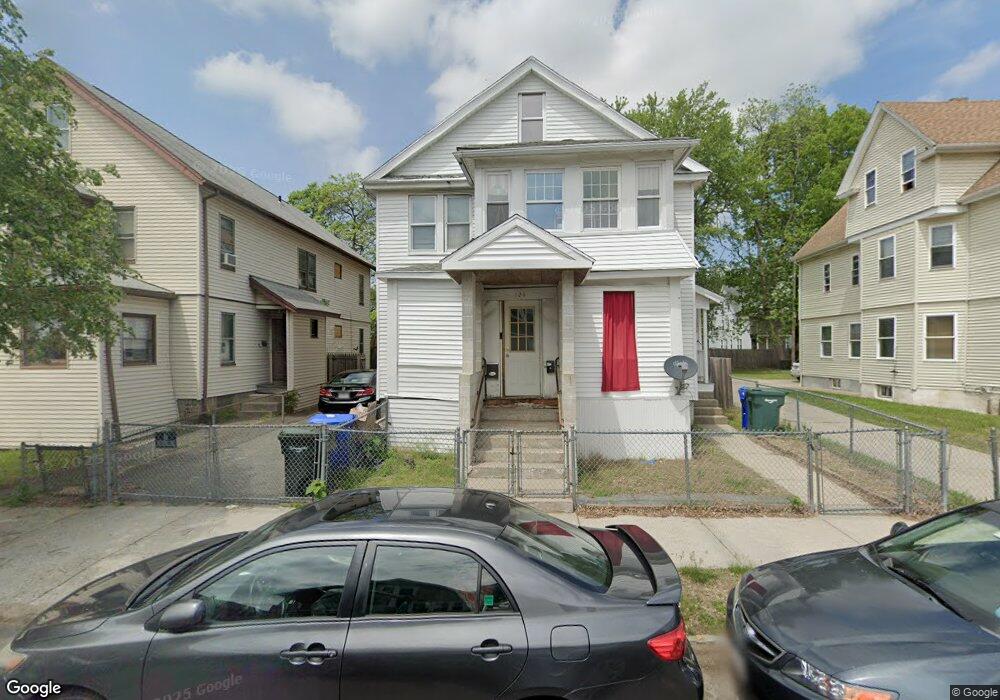
124 Johnson St Unit 126 Springfield, MA 01108
Forest Park NeighborhoodEstimated Value: $297,000 - $340,000
6
Beds
2
Baths
2,510
Sq Ft
$124/Sq Ft
Est. Value
About This Home
This home is located at 124 Johnson St Unit 126, Springfield, MA 01108 and is currently estimated at $311,418, approximately $124 per square foot. 124 Johnson St Unit 126 is a home located in Hampden County with nearby schools including White Street Elementary School, Forest Park Middle School, and High School Of Commerce.
Ownership History
Date
Name
Owned For
Owner Type
Purchase Details
Closed on
Mar 3, 2025
Sold by
Franco Nelson
Bought by
Victorino-Mejia Hanniel
Current Estimated Value
Home Financials for this Owner
Home Financials are based on the most recent Mortgage that was taken out on this home.
Original Mortgage
$221,925
Outstanding Balance
$220,451
Interest Rate
7.04%
Mortgage Type
Purchase Money Mortgage
Estimated Equity
$90,967
Purchase Details
Closed on
Apr 19, 2001
Sold by
Vega Henry J and Vega Catherine
Bought by
Franco Nelson
Home Financials for this Owner
Home Financials are based on the most recent Mortgage that was taken out on this home.
Original Mortgage
$81,352
Interest Rate
6.9%
Mortgage Type
Purchase Money Mortgage
Create a Home Valuation Report for This Property
The Home Valuation Report is an in-depth analysis detailing your home's value as well as a comparison with similar homes in the area
Home Values in the Area
Average Home Value in this Area
Purchase History
| Date | Buyer | Sale Price | Title Company |
|---|---|---|---|
| Victorino-Mejia Hanniel | $295,900 | None Available | |
| Victorino-Mejia Hanniel | $295,900 | None Available | |
| Franco Nelson | $82,000 | -- | |
| Franco Nelson | $82,000 | -- |
Source: Public Records
Mortgage History
| Date | Status | Borrower | Loan Amount |
|---|---|---|---|
| Open | Victorino-Mejia Hanniel | $221,925 | |
| Closed | Victorino-Mejia Hanniel | $221,925 | |
| Previous Owner | Franco Nelson | $81,352 | |
| Previous Owner | Franco Nelson | $65,000 |
Source: Public Records
Tax History
| Year | Tax Paid | Tax Assessment Tax Assessment Total Assessment is a certain percentage of the fair market value that is determined by local assessors to be the total taxable value of land and additions on the property. | Land | Improvement |
|---|---|---|---|---|
| 2025 | $4,050 | $258,300 | $29,600 | $228,700 |
| 2024 | $4,278 | $266,400 | $29,600 | $236,800 |
| 2023 | $3,615 | $212,000 | $27,000 | $185,000 |
| 2022 | $3,158 | $167,800 | $25,200 | $142,600 |
| 2021 | $3,119 | $165,000 | $22,900 | $142,100 |
| 2020 | $2,943 | $150,700 | $22,900 | $127,800 |
| 2019 | $2,822 | $143,400 | $22,900 | $120,500 |
| 2018 | $2,708 | $137,600 | $22,900 | $114,700 |
| 2017 | $2,562 | $130,300 | $21,500 | $108,800 |
| 2016 | $2,229 | $113,400 | $21,500 | $91,900 |
| 2015 | $2,191 | $111,400 | $21,500 | $89,900 |
Source: Public Records
Map
Nearby Homes
- 243 Orange St
- 327 Orange St
- 99 Wilmont St
- 192 White St
- 8 Wilmont St
- 21 Bloomfield St
- 305 Dickinson St
- 11 Crown St
- 202 Oakland St
- 88-90 Beaumont St
- 55 Malden St
- 33 Lansing Place
- 49-51 Mansfield St
- 7-9 Glendell Terrace
- 52 Herman St
- 15 Malden St
- 27 Ormond St
- 15-19 Litchfield St
- 0 Allen St (Ss)
- 12-14 Noel St
- 124-126 Johnson St
- 120 Johnson St Unit 122
- 130 Johnson St Unit 132
- 130-132 Johnson St
- 116 Johnson St Unit 118
- 116 Johnson St Unit 1
- 134 Johnson St Unit 136
- 134 Johnson St
- 125 Bloomfield St Unit 127
- 119 Bloomfield St Unit 121
- 110 Johnson St Unit 112
- 140 Johnson St Unit 142
- 131 Bloomfield St Unit 133
- 115 Bloomfield St Unit 117
- 110-112 Johnson St
- 123 Johnson St Unit 125
- 129 Johnson St Unit 131
- 119 Johnson St Unit 121
- 41 Johnson St
- 41 Johnson St
Your Personal Tour Guide
Ask me questions while you tour the home.