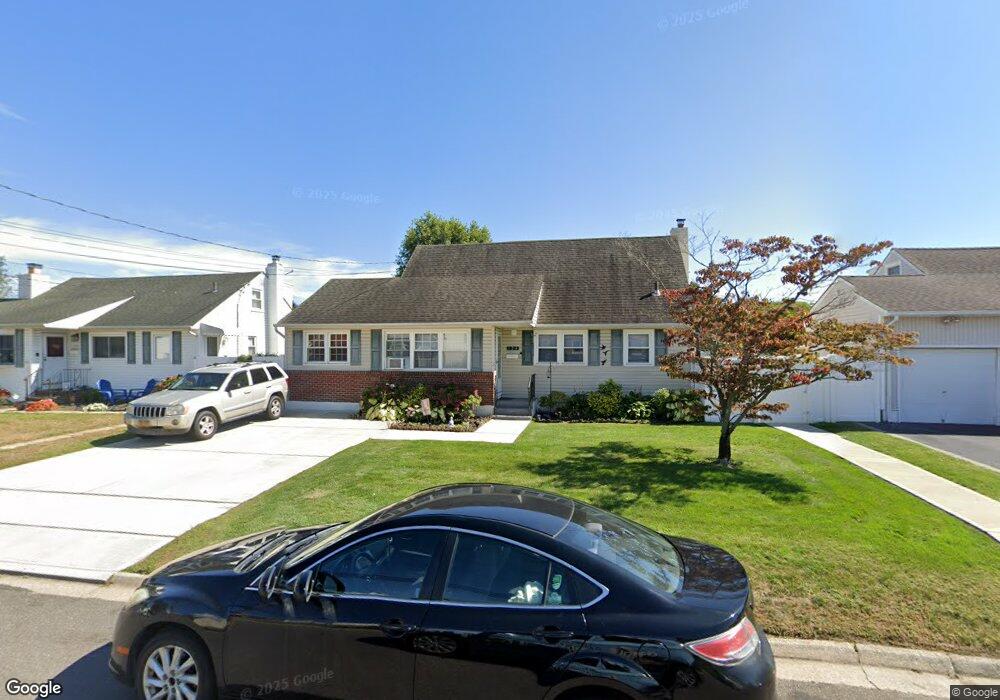
124 Justice St West Babylon, NY 11704
Estimated Value: $533,157 - $624,000
--
Bed
--
Bath
1,125
Sq Ft
$517/Sq Ft
Est. Value
About This Home
This home is located at 124 Justice St, West Babylon, NY 11704 and is currently estimated at $581,789, approximately $517 per square foot. 124 Justice St is a home located in Suffolk County.
Ownership History
Date
Name
Owned For
Owner Type
Purchase Details
Closed on
Oct 12, 2016
Sold by
Fiske Patricia
Bought by
Duryee Christina L
Current Estimated Value
Home Financials for this Owner
Home Financials are based on the most recent Mortgage that was taken out on this home.
Original Mortgage
$277,873
Outstanding Balance
$223,049
Interest Rate
3.5%
Mortgage Type
FHA
Estimated Equity
$358,740
Purchase Details
Closed on
Aug 20, 2009
Sold by
Fiske Joseph and Fiske Jean Marie
Bought by
Fiske Patricia
Home Financials for this Owner
Home Financials are based on the most recent Mortgage that was taken out on this home.
Original Mortgage
$120,000
Interest Rate
5.14%
Mortgage Type
Purchase Money Mortgage
Purchase Details
Closed on
Feb 16, 2007
Create a Home Valuation Report for This Property
The Home Valuation Report is an in-depth analysis detailing your home's value as well as a comparison with similar homes in the area
Home Values in the Area
Average Home Value in this Area
Purchase History
| Date | Buyer | Sale Price | Title Company |
|---|---|---|---|
| Duryee Christina L | $283,000 | None Available | |
| Fiske Patricia | -- | -- | |
| -- | -- | -- |
Source: Public Records
Mortgage History
| Date | Status | Borrower | Loan Amount |
|---|---|---|---|
| Open | Duryee Christina L | $277,873 | |
| Previous Owner | Fiske Patricia | $120,000 |
Source: Public Records
Tax History Compared to Growth
Tax History
| Year | Tax Paid | Tax Assessment Tax Assessment Total Assessment is a certain percentage of the fair market value that is determined by local assessors to be the total taxable value of land and additions on the property. | Land | Improvement |
|---|---|---|---|---|
| 2024 | $10,761 | $2,780 | $300 | $2,480 |
| 2023 | $10,761 | $2,780 | $300 | $2,480 |
| 2022 | $3,970 | $2,780 | $300 | $2,480 |
| 2021 | $3,970 | $2,780 | $300 | $2,480 |
| 2020 | $9,438 | $2,780 | $300 | $2,480 |
| 2019 | $9,438 | $0 | $0 | $0 |
| 2018 | $10,843 | $2,750 | $300 | $2,450 |
| 2017 | $10,843 | $2,750 | $300 | $2,450 |
| 2016 | $4,394 | $2,750 | $300 | $2,450 |
| 2015 | -- | $2,520 | $295 | $2,225 |
| 2014 | -- | $2,520 | $295 | $2,225 |
Source: Public Records
Map
Nearby Homes
- 108 Justice St
- 83 Justice St
- 256 Justice St
- 265 Kellum St
- 61 Kellum St Unit A and B
- 61 Kellum St Unit 61A
- 45 Farber Dr
- 16 Burton Place
- 86 Farber Dr Unit 86
- 702 6th St
- 200 Farber Dr Unit 200
- 210 Farber Dr Unit 210
- 926 9th St
- 10 13th Ave
- 583 Straight Path
- 1029 N Niagara Ave
- 45 Feustal St
- 918 10th St
- 1212 Herzel Blvd
- 456 Heathcote Rd