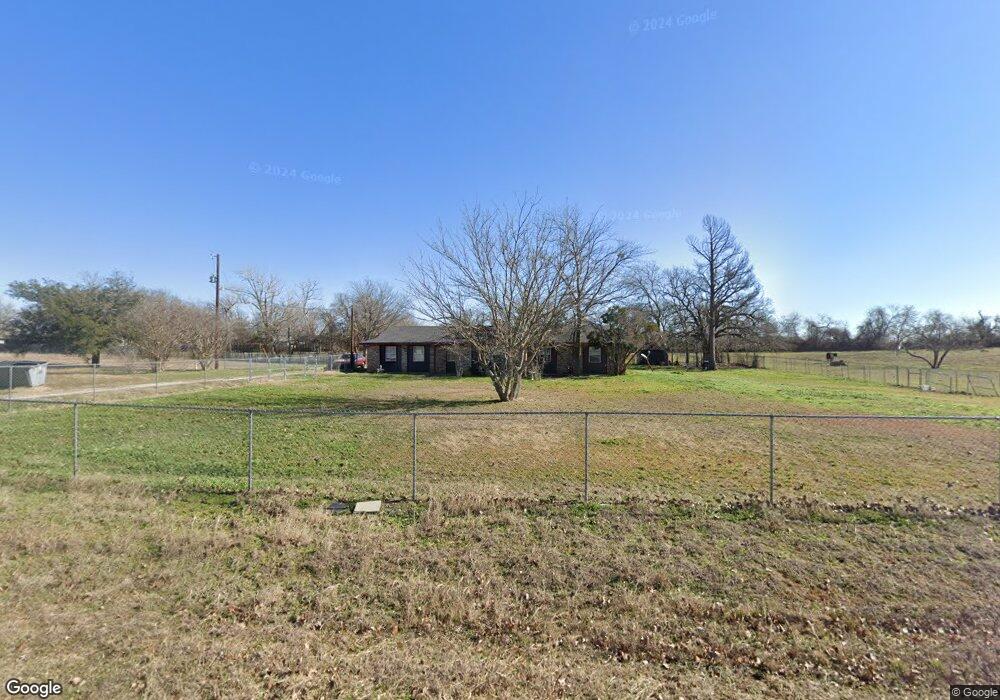
124 La Vega Trail Weatherford, TX 76088
Estimated Value: $420,968 - $532,000
--
Bed
--
Bath
1,982
Sq Ft
$236/Sq Ft
Est. Value
About This Home
This home is located at 124 La Vega Trail, Weatherford, TX 76088 and is currently estimated at $467,492, approximately $235 per square foot. 124 La Vega Trail is a home located in Parker County with nearby schools including Peaster Elementary School, Peaster Middle School, and Peaster High School.
Ownership History
Date
Name
Owned For
Owner Type
Purchase Details
Closed on
Jun 30, 2025
Sold by
Gustafson Shannon Michael Riley and Lemons Richard
Bought by
Gray Adam
Current Estimated Value
Home Financials for this Owner
Home Financials are based on the most recent Mortgage that was taken out on this home.
Original Mortgage
$100,000
Outstanding Balance
$99,306
Interest Rate
5.92%
Mortgage Type
New Conventional
Estimated Equity
$368,186
Purchase Details
Closed on
Jun 26, 2025
Sold by
Gustafson Teresa Gwen
Bought by
Gustafson Albert Tage Cecil
Home Financials for this Owner
Home Financials are based on the most recent Mortgage that was taken out on this home.
Original Mortgage
$100,000
Outstanding Balance
$99,306
Interest Rate
5.92%
Mortgage Type
New Conventional
Estimated Equity
$368,186
Purchase Details
Closed on
Nov 8, 2007
Sold by
Gustafson Bernie A
Bought by
Gustafson Albert T C
Create a Home Valuation Report for This Property
The Home Valuation Report is an in-depth analysis detailing your home's value as well as a comparison with similar homes in the area
Home Values in the Area
Average Home Value in this Area
Purchase History
| Date | Buyer | Sale Price | Title Company |
|---|---|---|---|
| Gray Adam | -- | None Listed On Document | |
| Gustafson Albert Tage Cecil | -- | None Listed On Document | |
| Gustafson Albert T C | -- | -- | |
| Gustafson Ii Albert Tage Cecil | -- | None Available |
Source: Public Records
Mortgage History
| Date | Status | Borrower | Loan Amount |
|---|---|---|---|
| Open | Gray Adam | $100,000 |
Source: Public Records
Tax History Compared to Growth
Tax History
| Year | Tax Paid | Tax Assessment Tax Assessment Total Assessment is a certain percentage of the fair market value that is determined by local assessors to be the total taxable value of land and additions on the property. | Land | Improvement |
|---|---|---|---|---|
| 2025 | $1,034 | $316,960 | -- | -- |
| 2024 | $1,034 | $288,145 | -- | -- |
| 2023 | $1,034 | $261,950 | $0 | $0 |
| 2022 | $4,750 | $261,900 | $110,840 | $151,060 |
| 2021 | $4,352 | $261,900 | $110,840 | $151,060 |
| 2020 | $4,037 | $208,700 | $51,510 | $157,190 |
| 2019 | $3,855 | $208,700 | $51,510 | $157,190 |
| 2018 | $3,515 | $162,650 | $40,770 | $121,880 |
| 2017 | $3,482 | $162,650 | $40,770 | $121,880 |
| 2016 | $3,166 | $147,190 | $40,770 | $106,420 |
| 2015 | $1,276 | $147,190 | $40,770 | $106,420 |
| 2014 | $1,386 | $130,790 | $40,770 | $90,020 |
Source: Public Records
Map
Nearby Homes
- 127 Jamar Dr
- 2883 Harwell Lake Rd
- 250 Lakeview Ct
- 2411 Sweet Springs Rd
- 235 Rock Springs Rd
- 5197 Zion Hill Rd
- 1005 Spring Ranch Dr
- 3879 Zion Hill Rd
- 2687 Mcclendon Rd
- 1961 Mcclendon Rd
- 2000 Sweet Springs Rd
- 1723 Mcclendon Rd
- 1728 Sweet Springs Rd
- 3024 Greg Allen Dr
- 5009 Glenoaks Ct
- 5005 Glenoaks Ct
- TBD Bellenger
- 217 Naibara Trail
- 2085 Glenhollow Dr
- 0 La Estada Dr
- 125 La Vega Trail
- 111 La Costa Cir
- 105 La Costa Cir
- 117 La Vega Trail
- 110 La Costa Cir
- 110 La Vega Trail
- 122 La Costa Cir
- 131 Jamar Dr
- 123 La Costa Cir
- 61 La Costa Cir
- 2700 Harwell Lake Rd
- 4369 Zion Hill Rd
- 999 Jamar Dr
- 130 Jamar Dr
- 128 Jamar Dr
- 2637 Harwell Lake Rd
- 136 Jamar Dr
- 110 La Vista Ct
- 2524 Harwell Lake Rd
- 2613 Harwell Lake Rd