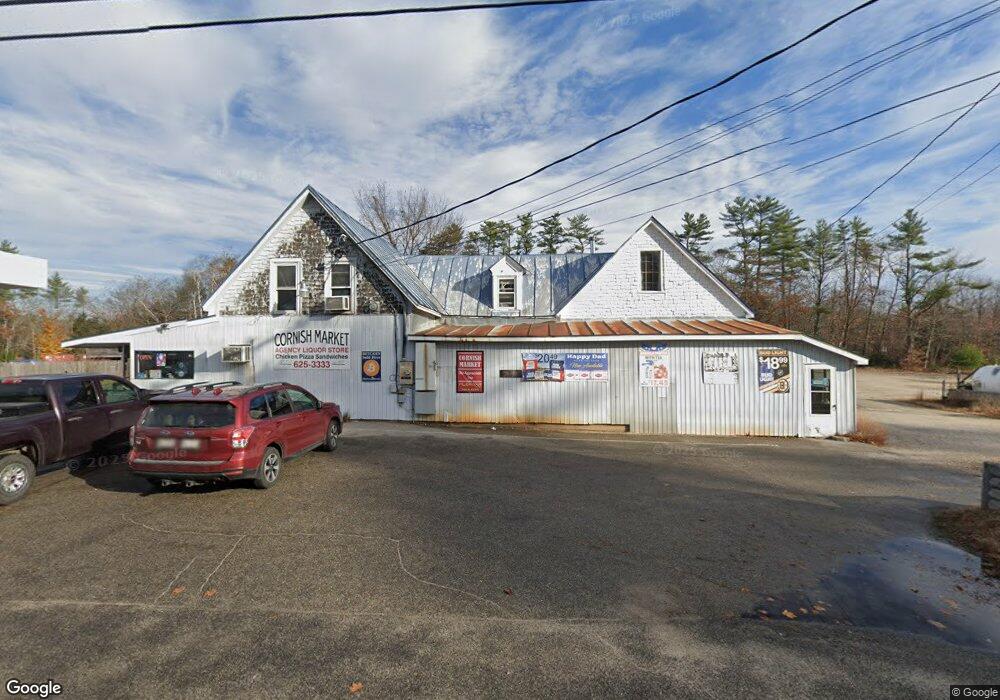
124 Main St Cornish, ME 04020
Estimated Value: $528,769
2
Beds
1
Bath
4,280
Sq Ft
$124/Sq Ft
Est. Value
About This Home
This home is located at 124 Main St, Cornish, ME 04020 and is currently estimated at $528,769, approximately $123 per square foot. 124 Main St is a home located in York County.
Ownership History
Date
Name
Owned For
Owner Type
Purchase Details
Closed on
Oct 14, 2022
Sold by
Cornish Prop Hldg Llc
Bought by
124 Main Street Llc
Current Estimated Value
Home Financials for this Owner
Home Financials are based on the most recent Mortgage that was taken out on this home.
Original Mortgage
$210,000
Outstanding Balance
$200,207
Interest Rate
5.66%
Mortgage Type
Purchase Money Mortgage
Estimated Equity
$328,562
Purchase Details
Closed on
Nov 1, 2013
Sold by
124 Main Street Llc
Bought by
Cornish Prop Hldgs Llc
Home Financials for this Owner
Home Financials are based on the most recent Mortgage that was taken out on this home.
Original Mortgage
$242,500
Interest Rate
4.52%
Mortgage Type
Commercial
Purchase Details
Closed on
Jan 17, 2012
Sold by
Mason Bernard G
Bought by
124 Main Street Llc
Create a Home Valuation Report for This Property
The Home Valuation Report is an in-depth analysis detailing your home's value as well as a comparison with similar homes in the area
Home Values in the Area
Average Home Value in this Area
Purchase History
| Date | Buyer | Sale Price | Title Company |
|---|---|---|---|
| 124 Main Street Llc | $440,600 | None Available | |
| 124 Main Street Llc | $440,600 | None Available | |
| 124 Main Street Llc | $440,600 | None Available | |
| Cornish Prop Hldgs Llc | -- | -- | |
| Cornish Prop Hldgs Llc | -- | -- | |
| Cornish Prop Hldgs Llc | -- | -- | |
| 124 Main Street Llc | $443,300 | -- | |
| 124 Main Street Llc | $443,300 | -- | |
| 124 Main Street Llc | $443,300 | -- |
Source: Public Records
Mortgage History
| Date | Status | Borrower | Loan Amount |
|---|---|---|---|
| Open | 124 Main Street Llc | $210,000 | |
| Closed | 124 Main Street Llc | $210,000 | |
| Previous Owner | Cornish Prop Hldgs Llc | $242,500 |
Source: Public Records
Tax History
| Year | Tax Paid | Tax Assessment Tax Assessment Total Assessment is a certain percentage of the fair market value that is determined by local assessors to be the total taxable value of land and additions on the property. | Land | Improvement |
|---|---|---|---|---|
| 2025 | $4,306 | $455,700 | $122,600 | $333,100 |
| 2024 | $6,599 | $717,300 | $362,100 | $355,200 |
| 2023 | $6,301 | $440,600 | $160,300 | $280,300 |
| 2022 | $6,080 | $440,600 | $160,300 | $280,300 |
| 2021 | $5,948 | $440,600 | $160,300 | $280,300 |
| 2020 | $1,306 | $440,600 | $160,300 | $280,300 |
| 2019 | $3,654 | $440,600 | $160,300 | $280,300 |
| 2018 | $5,948 | $440,600 | $160,300 | $280,300 |
| 2016 | $5,679 | $440,600 | $160,300 | $280,300 |
| 2015 | $5,791 | $448,900 | $160,300 | $288,600 |
| 2014 | $5,898 | $457,200 | $160,300 | $296,900 |
Source: Public Records
Map
Nearby Homes
- 4 Bridge St
- 6-13 Main St
- 20 Main St
- 96 Maple St
- Lot #3 Jordan Heights Rd
- Lot #2 Jordan Heights Rd
- Lot #8 Jordan Heights Rd
- Lot #4 Jordan Heights Rd
- 490 S Hiram Rd
- 992 Pequawket Trail
- 198 Senator Black Rd
- 0 Durgintown Rd
- 174 Marston Rd
- TBD Sokokis Trail N
- 5 Kimball Hill Rd
- 8 Graffam Rd
- 8 - A Graffam Rd
- 50AC Sawyer Mountain Rd
- 30 Graffam Rd
- 12 Main St
Your Personal Tour Guide
Ask me questions while you tour the home.