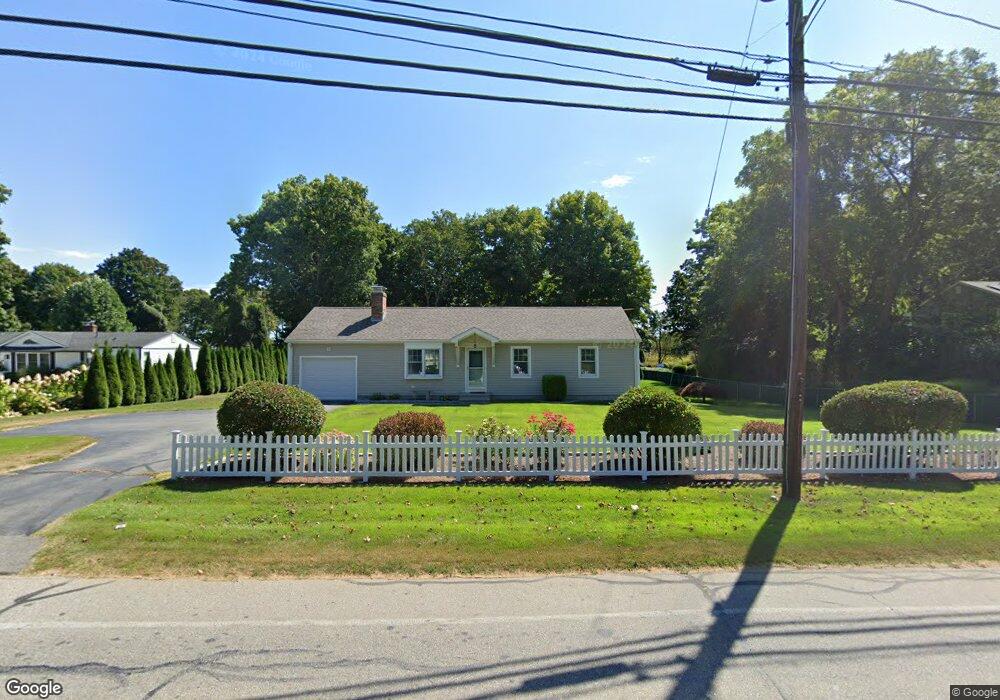
124 Maple Ave Old Saybrook, CT 06475
Estimated Value: $1,334,000 - $2,056,059
5
Beds
5
Baths
4,122
Sq Ft
$425/Sq Ft
Est. Value
About This Home
This home is located at 124 Maple Ave, Old Saybrook, CT 06475 and is currently estimated at $1,752,353, approximately $425 per square foot. 124 Maple Ave is a home located in Middlesex County with nearby schools including Kathleen E. Goodwin School, Old Saybrook Middle School, and Old Saybrook Senior High School.
Ownership History
Date
Name
Owned For
Owner Type
Purchase Details
Closed on
Dec 9, 2014
Sold by
Ann S Yolles Ft
Bought by
Yolles Robert G
Current Estimated Value
Purchase Details
Closed on
Feb 6, 2004
Sold by
Grochowski Robert J and Grochowski Jane A
Bought by
Yolles Robert G and Yolles Ann M
Purchase Details
Closed on
Jul 14, 1995
Sold by
Jacobson Sherwood and Jacobson Ruth
Bought by
Grochowski Robert J and Grochowski Jane A
Purchase Details
Closed on
Dec 31, 1990
Sold by
Odell Kenneth C
Bought by
Jacobson Sherwood
Create a Home Valuation Report for This Property
The Home Valuation Report is an in-depth analysis detailing your home's value as well as a comparison with similar homes in the area
Home Values in the Area
Average Home Value in this Area
Purchase History
| Date | Buyer | Sale Price | Title Company |
|---|---|---|---|
| Yolles Robert G | -- | -- | |
| Yolles Robert G | $850,000 | -- | |
| Grochowski Robert J | $325,000 | -- | |
| Jacobson Sherwood | $295,000 | -- |
Source: Public Records
Mortgage History
| Date | Status | Borrower | Loan Amount |
|---|---|---|---|
| Previous Owner | Jacobson Sherwood | $360,000 | |
| Previous Owner | Jacobson Sherwood | $148,200 |
Source: Public Records
Tax History Compared to Growth
Tax History
| Year | Tax Paid | Tax Assessment Tax Assessment Total Assessment is a certain percentage of the fair market value that is determined by local assessors to be the total taxable value of land and additions on the property. | Land | Improvement |
|---|---|---|---|---|
| 2025 | $18,089 | $1,167,000 | $574,400 | $592,600 |
| 2024 | $17,738 | $1,167,000 | $574,400 | $592,600 |
| 2023 | $16,434 | $803,600 | $368,900 | $434,700 |
| 2022 | $16,136 | $803,600 | $368,900 | $434,700 |
| 2021 | $16,112 | $803,600 | $368,900 | $434,700 |
| 2020 | $16,112 | $803,600 | $368,900 | $434,700 |
| 2019 | $15,871 | $803,600 | $368,900 | $434,700 |
| 2018 | $16,080 | $820,400 | $269,100 | $551,300 |
| 2017 | $16,129 | $820,400 | $269,100 | $551,300 |
| 2016 | $15,801 | $820,400 | $269,100 | $551,300 |
| 2015 | $15,432 | $820,400 | $269,100 | $551,300 |
| 2014 | $15,177 | $820,400 | $269,100 | $551,300 |
Source: Public Records
Map
Nearby Homes