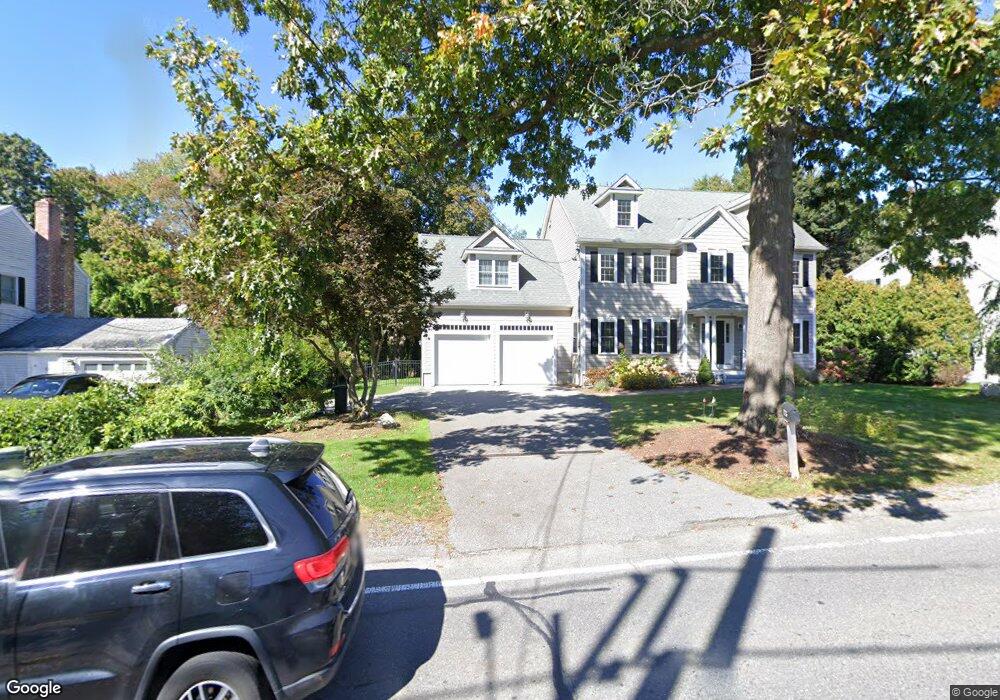
124 Maple St Lexington, MA 02420
Countryside NeighborhoodEstimated Value: $2,004,000 - $2,346,000
5
Beds
4
Baths
3,391
Sq Ft
$638/Sq Ft
Est. Value
About This Home
This home is located at 124 Maple St, Lexington, MA 02420 and is currently estimated at $2,165,010, approximately $638 per square foot. 124 Maple St is a home located in Middlesex County with nearby schools including Harrington Elementary School, Jonas Clarke Middle School, and Lexington High School.
Ownership History
Date
Name
Owned For
Owner Type
Purchase Details
Closed on
May 8, 2019
Sold by
Zue Timothy S and Zue Nicole M
Bought by
Jun Mina and Park Jun-Geun
Current Estimated Value
Home Financials for this Owner
Home Financials are based on the most recent Mortgage that was taken out on this home.
Original Mortgage
$750,000
Outstanding Balance
$656,709
Interest Rate
4%
Mortgage Type
Purchase Money Mortgage
Estimated Equity
$1,508,301
Purchase Details
Closed on
Oct 20, 2011
Sold by
Lambda Dev Co Llc
Bought by
Zue Timothy S and Zue Nicole M
Home Financials for this Owner
Home Financials are based on the most recent Mortgage that was taken out on this home.
Original Mortgage
$724,500
Interest Rate
3%
Mortgage Type
Purchase Money Mortgage
Purchase Details
Closed on
Dec 17, 2010
Sold by
Behnke Robert Est
Bought by
Lambda Dev Co Llc
Purchase Details
Closed on
Nov 6, 2007
Sold by
Behnke Marion A and Behnke Robert B
Bought by
Behnke Robert B
Create a Home Valuation Report for This Property
The Home Valuation Report is an in-depth analysis detailing your home's value as well as a comparison with similar homes in the area
Home Values in the Area
Average Home Value in this Area
Purchase History
| Date | Buyer | Sale Price | Title Company |
|---|---|---|---|
| Jun Mina | $1,500,000 | -- | |
| Zue Timothy S | $1,035,000 | -- | |
| Lambda Dev Co Llc | $350,000 | -- | |
| Behnke Robert B | -- | -- |
Source: Public Records
Mortgage History
| Date | Status | Borrower | Loan Amount |
|---|---|---|---|
| Open | Jun Mina | $750,000 | |
| Previous Owner | Zue Timothy S | $724,500 |
Source: Public Records
Tax History Compared to Growth
Tax History
| Year | Tax Paid | Tax Assessment Tax Assessment Total Assessment is a certain percentage of the fair market value that is determined by local assessors to be the total taxable value of land and additions on the property. | Land | Improvement |
|---|---|---|---|---|
| 2025 | $21,537 | $1,761,000 | $718,000 | $1,043,000 |
| 2024 | $20,715 | $1,691,000 | $684,000 | $1,007,000 |
| 2023 | $18,746 | $1,442,000 | $622,000 | $820,000 |
| 2022 | $18,216 | $1,320,000 | $565,000 | $755,000 |
| 2021 | $18,088 | $1,257,000 | $515,000 | $742,000 |
| 2020 | $16,874 | $1,201,000 | $515,000 | $686,000 |
| 2019 | $16,478 | $1,167,000 | $491,000 | $676,000 |
| 2018 | $15,201 | $1,063,000 | $417,000 | $646,000 |
| 2017 | $14,896 | $1,028,000 | $397,000 | $631,000 |
| 2016 | $14,965 | $1,025,000 | $374,000 | $651,000 |
| 2015 | $14,964 | $1,007,000 | $374,000 | $633,000 |
| 2014 | $14,890 | $960,000 | $340,000 | $620,000 |
Source: Public Records
Map
Nearby Homes
- 22 Bryant Rd
- 218 Lowell St
- 5 Carnegie Place
- 197 Woburn St
- 8 Blueberry Ln
- 15 Peachtree Rd
- 22 Tyler Rd
- 25 Maple St
- 7 Whipple Rd
- 71 Webb St
- 30 Whipple Rd
- 500 Lexington St Unit 6
- 20 Marrett Rd
- 19 Gershon Way Unit 1
- 19 Gershon Way
- 21 Derby Dr Unit 21
- 14 Nassau Dr
- 35 Tower Rd
- 10 Eliot Rd
- 36 Independence Ave