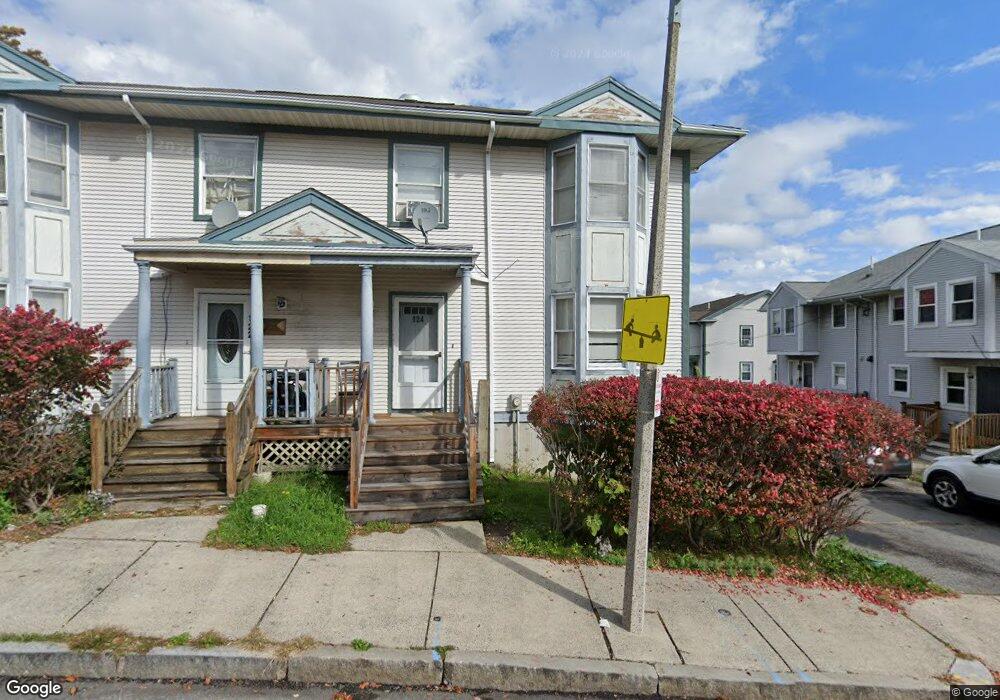
124 Moreland St Roxbury, MA 02119
Dudley-Brunswick King NeighborhoodEstimated Value: $257,000 - $598,000
3
Beds
2
Baths
1,398
Sq Ft
$304/Sq Ft
Est. Value
About This Home
This home is located at 124 Moreland St, Roxbury, MA 02119 and is currently estimated at $425,100, approximately $304 per square foot. 124 Moreland St is a home located in Suffolk County with nearby schools including Dudley Street Neighborhood Charter School and City on a Hill Charter Public School.
Ownership History
Date
Name
Owned For
Owner Type
Purchase Details
Closed on
Jan 12, 2022
Sold by
Milton Flora D Est and Milton
Bought by
Cole Natia J
Current Estimated Value
Home Financials for this Owner
Home Financials are based on the most recent Mortgage that was taken out on this home.
Original Mortgage
$161,505
Outstanding Balance
$148,114
Interest Rate
3.05%
Mortgage Type
Purchase Money Mortgage
Estimated Equity
$276,986
Purchase Details
Closed on
Aug 12, 2016
Sold by
Dni Winthrop Estates L
Bought by
Dudley Neighbors Holdi
Purchase Details
Closed on
Dec 30, 2013
Sold by
Dudley St Nbhd Initiat
Bought by
Milton Flora
Purchase Details
Closed on
Apr 25, 2013
Sold by
Milton Flora D and Milton Kurtis L
Bought by
Milton Steven
Purchase Details
Closed on
Dec 30, 2005
Sold by
Dudley Neighbors Inc
Bought by
Dni Winthrop Ests Llc
Create a Home Valuation Report for This Property
The Home Valuation Report is an in-depth analysis detailing your home's value as well as a comparison with similar homes in the area
Home Values in the Area
Average Home Value in this Area
Purchase History
| Date | Buyer | Sale Price | Title Company |
|---|---|---|---|
| Cole Natia J | $166,500 | None Available | |
| Dudley Neighbors Holdi | -- | -- | |
| Dudley Neighbors Holdi | -- | -- | |
| Milton Flora | $90,000 | -- | |
| Milton Flora | $90,000 | -- | |
| Milton Steven | -- | -- | |
| Milton Steven | -- | -- | |
| Dni Winthrop Ests Llc | -- | -- | |
| Dni Winthrop Ests Llc | -- | -- |
Source: Public Records
Mortgage History
| Date | Status | Borrower | Loan Amount |
|---|---|---|---|
| Open | Cole Natia J | $161,505 | |
| Previous Owner | Dni Winthrop Ests Llc | $65,500 |
Source: Public Records
Tax History Compared to Growth
Tax History
| Year | Tax Paid | Tax Assessment Tax Assessment Total Assessment is a certain percentage of the fair market value that is determined by local assessors to be the total taxable value of land and additions on the property. | Land | Improvement |
|---|---|---|---|---|
| 2025 | $2,125 | $183,500 | $60,555 | $122,945 |
| 2024 | $1,905 | $174,800 | $47,196 | $127,604 |
| 2023 | $1,788 | $166,500 | $58,482 | $108,018 |
| 2022 | $2,357 | $216,600 | $58,482 | $158,118 |
| 2021 | $2,201 | $206,300 | $0 | $206,300 |
| 2020 | $2,075 | $196,459 | $85,400 | $111,059 |
| 2019 | $1,878 | $178,200 | $86,300 | $91,900 |
| 2018 | $1,778 | $169,700 | $86,300 | $83,400 |
| 2017 | $1,711 | $161,600 | $86,300 | $75,300 |
| 2016 | $1,693 | $153,931 | $86,400 | $67,531 |
| 2015 | $1,090 | $90,000 | $67,400 | $22,600 |
| 2014 | $1,756 | $139,620 | $67,400 | $72,220 |
Source: Public Records
Map
Nearby Homes
- 80 Blue Hill Ave Unit 5
- 45 Woodville St
- 79 W Cottage St
- 24 Clarence St Unit 24R
- 119 Blue Hill Ave
- 22 Alaska St
- 108 Mount Pleasant Ave Unit 108R
- 33 Copeland Park Unit C
- 133 Blue Hill Ave
- Lot 84 Blue Hill Ave
- 101 Mount Pleasant Ave
- 31 Alaska St
- 59 Perrin St
- 59 Perrin St Unit 1
- 7 Langford Park Unit 3
- 21 Dean St
- 62 Clifford St Unit A
- 30 Copeland St Unit 1
- 36 Brookford St
- 66 Burrell St
- 122 Moreland St
- 27 Dennis St
- 29 Dennis St
- 25 Dennis St
- 153 Winthrop St
- 33 Dennis St
- 23 Dennis St
- 149 Winthrop St
- 37 Dennis St
- 58 Blue Hill Ave
- 58 Blue Hill Ave Unit 2
- 58 Blue Hill Ave Unit 1
- 58 Blue Hill Ave Unit 3
- 40 Dennis St
- 19 Dennis St
- 115 Moreland St
- 39 Dennis St
- 42 Dennis St
- 42 Dennis St
- 42 Dennis St Unit 1