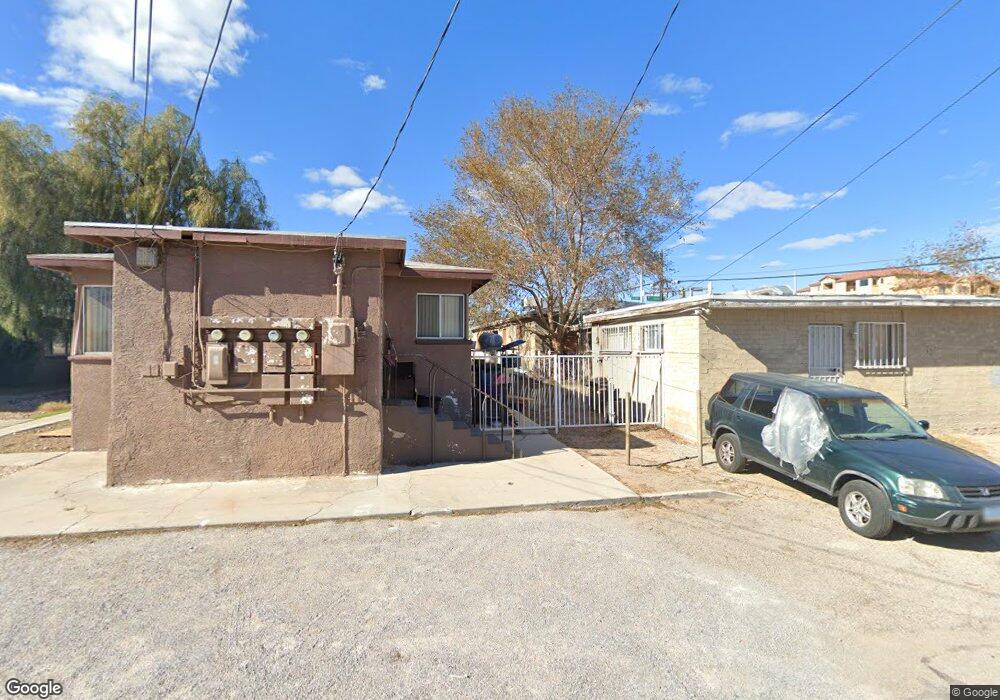
124 N 13th St Las Vegas, NV 89101
Downtown Las Vegas NeighborhoodEstimated Value: $224,000 - $605,000
4
Beds
4
Baths
2,400
Sq Ft
$192/Sq Ft
Est. Value
About This Home
This home is located at 124 N 13th St, Las Vegas, NV 89101 and is currently estimated at $460,333, approximately $191 per square foot. 124 N 13th St is a home located in Clark County with nearby schools including Howard E Hollingsworth Elementary School, Roy West Martin Middle School, and Valley High School.
Ownership History
Date
Name
Owned For
Owner Type
Purchase Details
Closed on
Jun 27, 2013
Sold by
702 Management Group Llc
Bought by
110 13Th Street Llc
Current Estimated Value
Purchase Details
Closed on
Sep 27, 2012
Sold by
33 Management Group Llc
Bought by
702 Management Group Llc
Purchase Details
Closed on
May 18, 2012
Sold by
Mazel Llc
Bought by
33 Management Group Llc
Home Financials for this Owner
Home Financials are based on the most recent Mortgage that was taken out on this home.
Original Mortgage
$50,000
Interest Rate
3.85%
Mortgage Type
Seller Take Back
Purchase Details
Closed on
Oct 11, 2011
Sold by
Henkin Howard
Bought by
Mazel Llc
Purchase Details
Closed on
Jun 9, 2011
Sold by
Share David L
Bought by
Henkin Howard
Create a Home Valuation Report for This Property
The Home Valuation Report is an in-depth analysis detailing your home's value as well as a comparison with similar homes in the area
Home Values in the Area
Average Home Value in this Area
Purchase History
| Date | Buyer | Sale Price | Title Company |
|---|---|---|---|
| 110 13Th Street Llc | $1,100,000 | Chicago Title Of Nevada | |
| 702 Management Group Llc | $36,146 | None Available | |
| 33 Management Group Llc | $114,000 | Lawyers Title Of Nevada Vil | |
| Mazel Llc | -- | None Available | |
| Henkin Howard | $130,000 | First American Title Paseo |
Source: Public Records
Mortgage History
| Date | Status | Borrower | Loan Amount |
|---|---|---|---|
| Previous Owner | 33 Management Group Llc | $50,000 |
Source: Public Records
Tax History Compared to Growth
Tax History
| Year | Tax Paid | Tax Assessment Tax Assessment Total Assessment is a certain percentage of the fair market value that is determined by local assessors to be the total taxable value of land and additions on the property. | Land | Improvement |
|---|---|---|---|---|
| 2025 | $749 | $42,685 | $42,685 | -- |
| 2024 | $694 | $42,685 | $42,685 | $19,877 |
| 2023 | $694 | $60,039 | $39,200 | $20,839 |
| 2022 | $643 | $50,187 | $30,800 | $19,387 |
| 2021 | $596 | $46,027 | $28,000 | $18,027 |
| 2020 | $550 | $45,698 | $28,000 | $17,698 |
| 2019 | $516 | $45,174 | $28,000 | $17,174 |
| 2018 | $492 | $34,342 | $18,130 | $16,212 |
| 2017 | $1,004 | $30,612 | $14,700 | $15,912 |
| 2016 | $462 | $24,044 | $8,400 | $15,644 |
| 2015 | $494 | $21,661 | $6,563 | $15,098 |
| 2014 | $479 | $20,964 | $6,563 | $14,401 |
Source: Public Records
Map
Nearby Homes
- 1220 E Ogden Ave
- 203 N 13th St
- 300 N 14th St
- 1505 E Ogden Ave
- 1408 E Carson Ave
- 333 N 13th St
- 1610 Stewart Ave
- 316 N 10th St
- 1601 Marlin Ave
- 362 N 13th St
- 317 N 10th St
- 364 N 13th St
- 370 N 13th St
- 200 N Bruce St Unit A
- 365 N 16th St
- 208 N Bruce St Unit A
- 208 N Bruce St Unit C
- 367 N 16th St
- 817 Stewart Ave
- 377 N 16th St
- 120 N 13th St
- 1300 E Ogden Ave
- 119 N 14th St
- 119 N 14th St Unit D
- 119 N 14th St Unit A
- 119 N 14th St Unit B
- 119 N 14th St Unit C
- 1301 E Ogden Ave Unit B
- 1301 E Ogden Ave Unit 1305
- 1301 E Ogden Ave Unit 1301
- 1301 E Ogden Ave Unit 1307
- 1301 E Ogden Ave Unit A
- 1301 E Ogden Ave
- 117 N 14th St Unit D
- 117 N 14th St Unit A
- 117 N 14th St Unit C
- 117 N 14th St Unit B
- 105 N 14th St
- 105 N 14th St Unit B
- 105 N 14th St Unit A