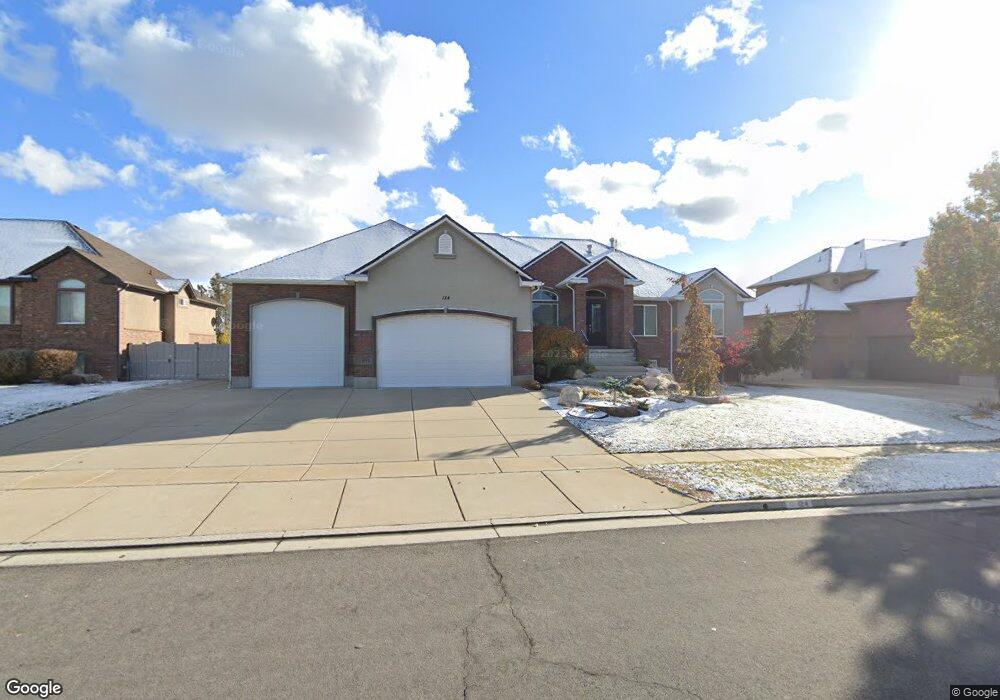
124 N 3375 W Layton, UT 84041
Estimated Value: $659,000 - $884,401
3
Beds
3
Baths
2,277
Sq Ft
$355/Sq Ft
Est. Value
About This Home
This home is located at 124 N 3375 W, Layton, UT 84041 and is currently estimated at $807,600, approximately $354 per square foot. 124 N 3375 W is a home located in Davis County with nearby schools including Sand Springs Elementary School, Legacy Junior High School, and Layton High School.
Ownership History
Date
Name
Owned For
Owner Type
Purchase Details
Closed on
Nov 4, 2020
Sold by
Rognon Donald W
Bought by
Rognon Donald W and Rognon Christine S
Current Estimated Value
Home Financials for this Owner
Home Financials are based on the most recent Mortgage that was taken out on this home.
Original Mortgage
$411,500
Outstanding Balance
$295,760
Interest Rate
2.9%
Mortgage Type
New Conventional
Estimated Equity
$511,840
Purchase Details
Closed on
Sep 10, 2007
Sold by
Rognon Donald W and Rognon Christine S
Bought by
Rognon Donald W and Rognon Christine S
Purchase Details
Closed on
Oct 16, 2006
Sold by
Wight Inc
Bought by
Rognon Donald W and Rognow Christine S
Home Financials for this Owner
Home Financials are based on the most recent Mortgage that was taken out on this home.
Original Mortgage
$500,000
Interest Rate
6.75%
Mortgage Type
Construction
Create a Home Valuation Report for This Property
The Home Valuation Report is an in-depth analysis detailing your home's value as well as a comparison with similar homes in the area
Home Values in the Area
Average Home Value in this Area
Purchase History
| Date | Buyer | Sale Price | Title Company |
|---|---|---|---|
| Rognon Donald W | -- | Mountain View Title & Escrow | |
| Rognon Donald W | -- | Mountain View Title | |
| Rognon Donald W | -- | Accommodation | |
| Rognon Donald W | -- | Bonneville Superior Title Co |
Source: Public Records
Mortgage History
| Date | Status | Borrower | Loan Amount |
|---|---|---|---|
| Open | Rognon Donald W | $411,500 | |
| Previous Owner | Rognon Donald W | $500,000 |
Source: Public Records
Tax History Compared to Growth
Tax History
| Year | Tax Paid | Tax Assessment Tax Assessment Total Assessment is a certain percentage of the fair market value that is determined by local assessors to be the total taxable value of land and additions on the property. | Land | Improvement |
|---|---|---|---|---|
| 2025 | $4,705 | $493,900 | $141,133 | $352,767 |
| 2024 | $4,468 | $472,450 | $149,217 | $323,233 |
| 2023 | $4,314 | $804,000 | $161,792 | $642,208 |
| 2022 | $4,635 | $469,150 | $91,676 | $377,474 |
| 2021 | $4,134 | $624,000 | $137,474 | $486,526 |
| 2020 | $3,736 | $541,000 | $118,151 | $422,849 |
| 2019 | $3,744 | $531,000 | $115,107 | $415,893 |
| 2018 | $3,455 | $492,000 | $101,623 | $390,377 |
| 2016 | $3,430 | $251,955 | $43,092 | $208,863 |
| 2015 | $3,131 | $218,350 | $43,092 | $175,258 |
| 2014 | $2,615 | $186,424 | $43,092 | $143,332 |
| 2013 | -- | $228,356 | $42,052 | $186,304 |
Source: Public Records
Map
Nearby Homes
- 101 S 3600 W
- 245 S Summer Breeze Ln
- 454 N 3550 W
- 567 W 3575 S
- 3583 W 200 S
- 3535 W Overlook Dr
- 3169 S 550 W
- 2794 W Gentile St
- 697 N 3275 W
- 3263 W 850 N
- 967 W Yamada Ct
- 2674 S 75 E
- 2875 N Hill Rd Unit 199
- 2875 N Hill Rd Unit 27
- 2681 S 200 E
- 3391 W 1125 N
- 818 N 2625 W
- 306 S Sunburst Dr
- 803 W 2800 S
- 162 E 2600 S