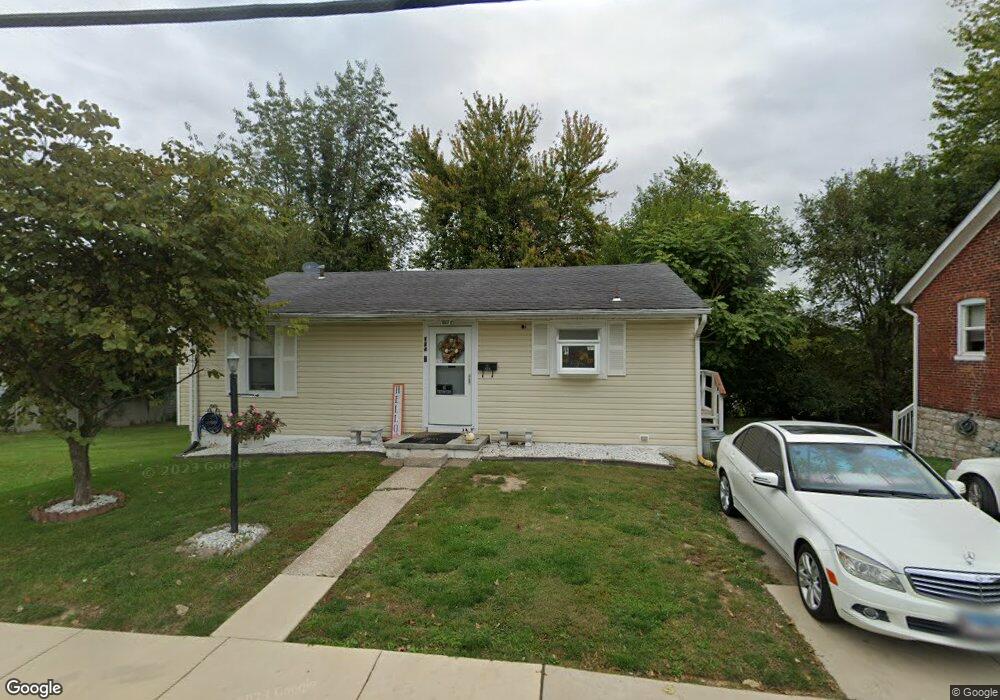
124 N 8th St Belleville, IL 62220
Estimated Value: $83,000 - $118,000
3
Beds
2
Baths
912
Sq Ft
$111/Sq Ft
Est. Value
About This Home
This home is located at 124 N 8th St, Belleville, IL 62220 and is currently estimated at $101,009, approximately $110 per square foot. 124 N 8th St is a home located in St. Clair County with nearby schools including Franklin Elementary School, Central Jr High School, and Governor French Academy.
Ownership History
Date
Name
Owned For
Owner Type
Purchase Details
Closed on
Jun 2, 2010
Sold by
Whitehead Michael L and Whitehead Nancy
Bought by
Slauson Adrianne
Current Estimated Value
Home Financials for this Owner
Home Financials are based on the most recent Mortgage that was taken out on this home.
Original Mortgage
$62,067
Outstanding Balance
$41,943
Interest Rate
5.14%
Mortgage Type
FHA
Estimated Equity
$59,066
Purchase Details
Closed on
Nov 21, 2003
Sold by
Minemann John W
Bought by
Whitehead Michael L and Whitehead Nancy
Create a Home Valuation Report for This Property
The Home Valuation Report is an in-depth analysis detailing your home's value as well as a comparison with similar homes in the area
Home Values in the Area
Average Home Value in this Area
Purchase History
| Date | Buyer | Sale Price | Title Company |
|---|---|---|---|
| Slauson Adrianne | $66,000 | Chicago Title | |
| Whitehead Michael L | $10,500 | Benchmark Title Company Llc |
Source: Public Records
Mortgage History
| Date | Status | Borrower | Loan Amount |
|---|---|---|---|
| Open | Slauson Adrianne | $62,067 |
Source: Public Records
Tax History
| Year | Tax Paid | Tax Assessment Tax Assessment Total Assessment is a certain percentage of the fair market value that is determined by local assessors to be the total taxable value of land and additions on the property. | Land | Improvement |
|---|---|---|---|---|
| 2024 | $1,531 | $23,414 | $2,259 | $21,155 |
| 2023 | $1,480 | $21,765 | $2,215 | $19,550 |
| 2022 | $1,301 | $19,594 | $1,994 | $17,600 |
| 2021 | $1,208 | $18,114 | $1,843 | $16,271 |
| 2020 | $1,148 | $17,130 | $1,743 | $15,387 |
| 2019 | $1,236 | $17,928 | $1,746 | $16,182 |
| 2018 | $1,195 | $17,540 | $1,708 | $15,832 |
| 2017 | $1,187 | $17,417 | $1,696 | $15,721 |
| 2016 | $1,166 | $17,047 | $1,660 | $15,387 |
| 2014 | $1,218 | $19,172 | $3,031 | $16,141 |
| 2013 | $1,754 | $19,446 | $3,074 | $16,372 |
Source: Public Records
Map
Nearby Homes
Your Personal Tour Guide
Ask me questions while you tour the home.