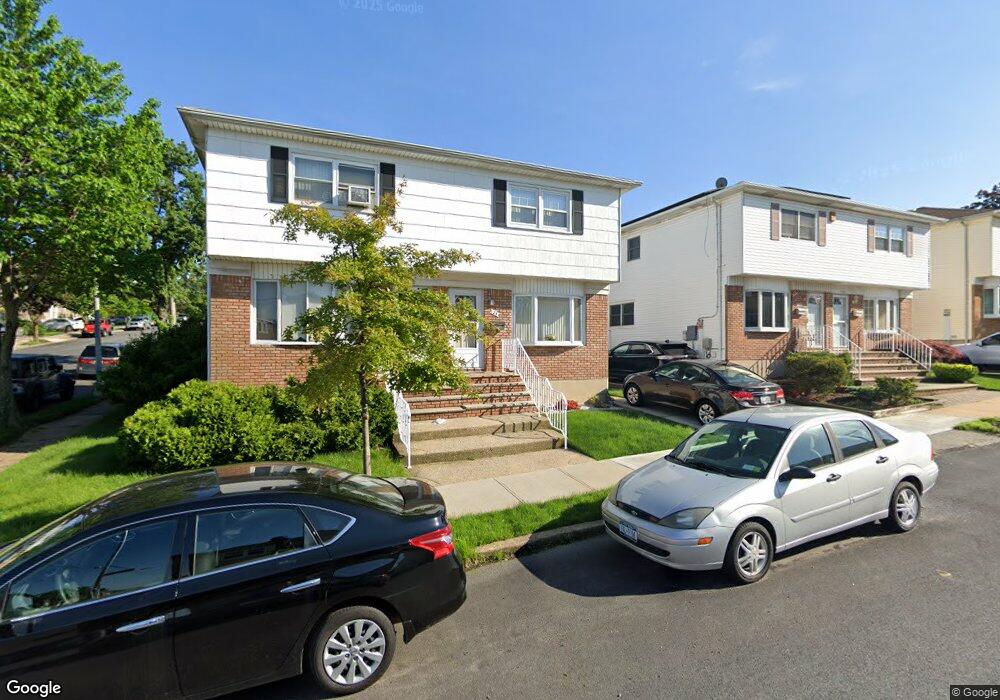
124 Oswego St Staten Island, NY 10301
Sunnyside NeighborhoodEstimated Value: $649,839 - $774,000
--
Bed
4
Baths
1,188
Sq Ft
$590/Sq Ft
Est. Value
About This Home
This home is located at 124 Oswego St, Staten Island, NY 10301 and is currently estimated at $701,460, approximately $590 per square foot. 124 Oswego St is a home located in Richmond County with nearby schools including P.S. 29 Bardwell, Intermediate School 27, and Curtis High School.
Ownership History
Date
Name
Owned For
Owner Type
Purchase Details
Closed on
Dec 13, 2021
Sold by
Ann Heidinger Toni
Bought by
Heidinger Toni Ann
Current Estimated Value
Purchase Details
Closed on
Mar 29, 2021
Sold by
Heidinger Toni Ann and Heidinger Jeffrey
Bought by
Heidinger Toni Ann and Spina Adrienne
Home Financials for this Owner
Home Financials are based on the most recent Mortgage that was taken out on this home.
Original Mortgage
$225,000
Interest Rate
3.17%
Create a Home Valuation Report for This Property
The Home Valuation Report is an in-depth analysis detailing your home's value as well as a comparison with similar homes in the area
Home Values in the Area
Average Home Value in this Area
Purchase History
| Date | Buyer | Sale Price | Title Company |
|---|---|---|---|
| Heidinger Toni Ann | $112,500 | None Listed On Document | |
| Heidinger Toni Ann | -- | Patriot Land Services Inc | |
| Heidinger Toni Ann | -- | Patriot Land Services Inc |
Source: Public Records
Mortgage History
| Date | Status | Borrower | Loan Amount |
|---|---|---|---|
| Previous Owner | Heidinger Toni Ann | $225,000 |
Source: Public Records
Tax History Compared to Growth
Tax History
| Year | Tax Paid | Tax Assessment Tax Assessment Total Assessment is a certain percentage of the fair market value that is determined by local assessors to be the total taxable value of land and additions on the property. | Land | Improvement |
|---|---|---|---|---|
| 2025 | $5,537 | $39,180 | $8,637 | $30,543 |
| 2024 | $5,537 | $36,420 | $8,766 | $27,654 |
| 2023 | $5,282 | $26,009 | $7,481 | $18,528 |
| 2022 | $4,899 | $34,860 | $11,580 | $23,280 |
| 2021 | $5,164 | $35,160 | $11,580 | $23,580 |
| 2020 | $6,385 | $32,940 | $11,580 | $21,360 |
| 2019 | $5,968 | $32,340 | $11,580 | $20,760 |
| 2018 | $4,418 | $21,674 | $8,300 | $13,374 |
| 2017 | $4,168 | $20,448 | $8,929 | $11,519 |
| 2016 | $4,088 | $20,448 | $10,637 | $9,811 |
| 2015 | $3,674 | $20,293 | $11,674 | $8,619 |
| 2014 | $3,674 | $19,145 | $10,955 | $8,190 |
Source: Public Records
Map
Nearby Homes