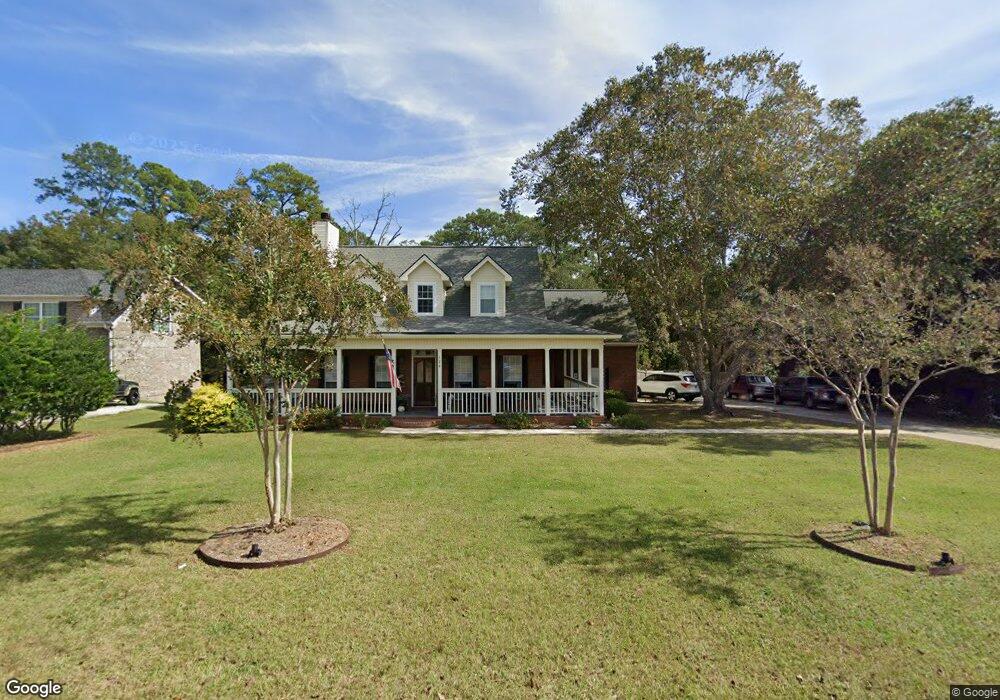
124 Partridge Run Rincon, GA 31326
Estimated Value: $394,036 - $479,000
About This Home
This home is located at 124 Partridge Run, Rincon, GA 31326 and is currently estimated at $430,509, approximately $211 per square foot. 124 Partridge Run is a home located in Effingham County with nearby schools including South Effingham Elementary School, South Effingham Middle School, and South Effingham High School.
Ownership History
We collect this data history from publicly available records. To have your information removed, we recommend requesting removal directly through your county’s website.
Purchase Details
Purchase Details
Home Financials for this Owner
Home Financials are based on the most recent Mortgage that was taken out on this home.Purchase Details
Home Financials for this Owner
Home Financials are based on the most recent Mortgage that was taken out on this home.Home Values in the Area
Average Home Value in this Area
Purchase History
We collect this data history from publicly available records. To have your information removed, we recommend requesting removal directly through your county’s website.
| Date | Buyer | Sale Price | Title Company |
|---|---|---|---|
| -- | -- | ||
| $228,900 | -- | ||
| -- | -- | ||
| $226,000 | -- |
Mortgage History
We collect this data history from publicly available records. To have your information removed, we recommend requesting removal directly through your county’s website.
| Date | Status | Borrower | Loan Amount |
|---|---|---|---|
| Previous Owner | $236,453 | ||
| Previous Owner | $180,800 | ||
| Previous Owner | $22,600 |
Tax History
We collect this data history from publicly available records. To have your information removed, we recommend requesting removal directly through your county’s website.
| Year | Tax Paid | Tax Assessment Tax Assessment Total Assessment is a certain percentage of the fair market value that is determined by local assessors to be the total taxable value of land and additions on the property. | Land | Improvement |
|---|---|---|---|---|
| 2025 | $3,583 | $154,930 | $30,000 | $124,930 |
| 2024 | $3,583 | $137,098 | $26,000 | $111,098 |
| 2023 | $2,605 | $136,503 | $20,800 | $115,703 |
| 2022 | $3,133 | $106,230 | $20,000 | $86,230 |
| 2021 | $3,064 | $97,188 | $20,000 | $77,188 |
| 2020 | $2,759 | $89,728 | $18,000 | $71,728 |
| 2019 | $2,775 | $89,728 | $18,000 | $71,728 |
| 2018 | $2,736 | $84,899 | $18,000 | $66,899 |
| 2017 | $2,847 | $84,899 | $18,000 | $66,899 |
| 2016 | $2,333 | $79,813 | $16,000 | $63,813 |
| 2015 | -- | $79,813 | $16,000 | $63,813 |
| 2014 | -- | $73,013 | $9,200 | $63,813 |
| 2013 | -- | $71,972 | $8,160 | $63,812 |
Map
- 426 Peachtree Dr
- 206 White Bluff Dr
- 2410 Hodgeville Rd
- 111 Lakewood Dr
- 305 Sting Ray Ct
- 203 Veranda Ave
- 305 Kolic Helmey Rd
- 106 Saddle Ln
- 1679 Hodgeville Rd
- 103 Kensington Cir
- 460 Kolic Helmey Rd
- 209 Alyssa Ave
- 204 Alyssa Ave
- 207 Alyssa Ave
- 440 Pecan Ln
- 416 Moss Loop
- 104 Summer Station Dr
- 103 Summer Station Dr
- 129 Summer Station Dr
- 109 Red Oak Ln
- 126 Partridge Run
- 122 Partridge Run
- 120 Partridge Run
- 117 Partridge Run
- 119 Hillside Dr
- 115 Partridge Run
- 128 Partridge Run
- 202 Partridge Ct
- 130 Partridge Run
- 121 Partridge Run
- 117 Hillside Dr
- 204 Partridge Ct
- 116 Hillside Dr
- 113 Partridge Run
- 118 Partridge Run
- 200 Partridge Ct
- 459 Peachtree Dr
- 0 Partridge Run Unit 9011493
- 123 Partridge Run
- 203 Partridge Ct
Ask me questions while you tour the home.