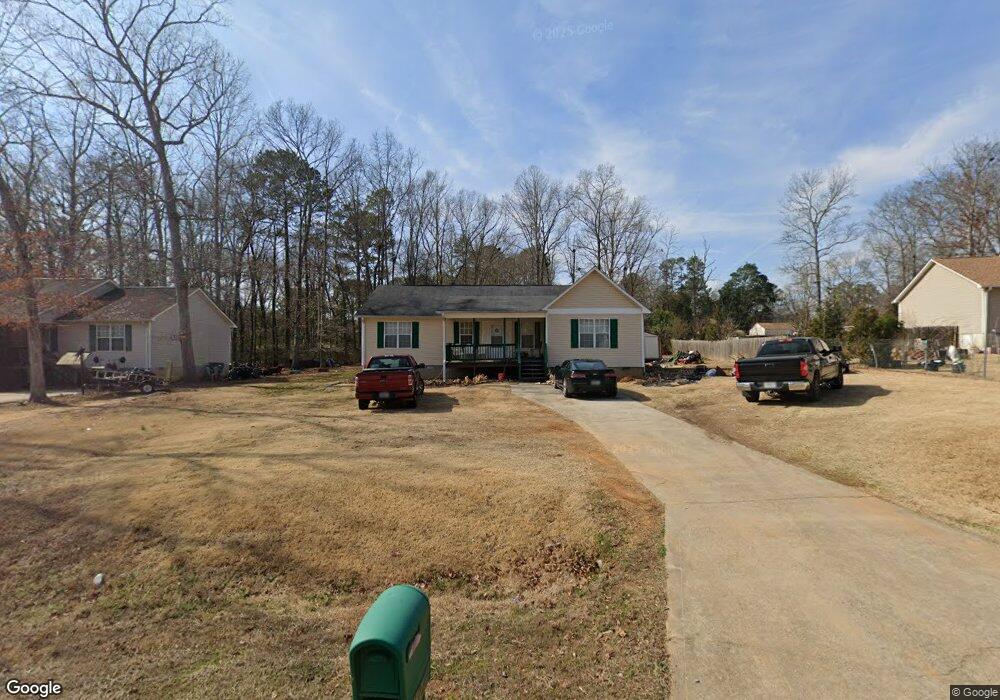
124 Pepperidge Ln Athens, GA 30607
Estimated Value: $240,000 - $278,000
3
Beds
2
Baths
1,440
Sq Ft
$184/Sq Ft
Est. Value
About This Home
This home is located at 124 Pepperidge Ln, Athens, GA 30607 and is currently estimated at $264,749, approximately $183 per square foot. 124 Pepperidge Ln is a home located in Clarke County with nearby schools including Burney-Harris-Lyons Middle School, Clarke Central High School, and Foothills Education Charter High School.
Ownership History
Date
Name
Owned For
Owner Type
Purchase Details
Closed on
Jul 30, 2010
Sold by
Secretary Of Housing
Bought by
Scott John Thomas
Current Estimated Value
Home Financials for this Owner
Home Financials are based on the most recent Mortgage that was taken out on this home.
Original Mortgage
$56,951
Outstanding Balance
$37,488
Interest Rate
4.61%
Mortgage Type
FHA
Estimated Equity
$227,261
Purchase Details
Closed on
Dec 1, 2009
Sold by
Johnson Ora L
Bought by
Midfirst Bank
Purchase Details
Closed on
Sep 10, 2001
Sold by
Johnson Ora and Alicia Willis
Bought by
Johnson Ora L
Purchase Details
Closed on
Aug 29, 2000
Sold by
R & G Homebuilders Inc
Bought by
Key Jerry
Purchase Details
Closed on
Aug 15, 2000
Sold by
Dearing Development Coroporation
Bought by
R & G Homebuilders Inc
Create a Home Valuation Report for This Property
The Home Valuation Report is an in-depth analysis detailing your home's value as well as a comparison with similar homes in the area
Home Values in the Area
Average Home Value in this Area
Purchase History
| Date | Buyer | Sale Price | Title Company |
|---|---|---|---|
| Scott John Thomas | $57,600 | -- | |
| Midfirst Bank | $143,300 | -- | |
| Johnson Ora L | $109,600 | -- | |
| Johnson Ora | $110,500 | -- | |
| Johnson Ora Lamont | $109,633 | -- | |
| Key Jerry | $18,000 | -- | |
| R & G Homebuilders Inc | $16,000 | -- |
Source: Public Records
Mortgage History
| Date | Status | Borrower | Loan Amount |
|---|---|---|---|
| Open | Scott John Thomas | $56,951 |
Source: Public Records
Tax History Compared to Growth
Tax History
| Year | Tax Paid | Tax Assessment Tax Assessment Total Assessment is a certain percentage of the fair market value that is determined by local assessors to be the total taxable value of land and additions on the property. | Land | Improvement |
|---|---|---|---|---|
| 2025 | $2,433 | $95,508 | $12,000 | $83,508 |
| 2024 | $2,433 | $92,357 | $12,000 | $80,357 |
| 2023 | $1,634 | $87,303 | $12,000 | $75,303 |
| 2022 | $1,860 | $68,292 | $10,400 | $57,892 |
| 2021 | $1,548 | $55,944 | $8,000 | $47,944 |
| 2020 | $1,396 | $51,434 | $8,000 | $43,434 |
| 2019 | $1,286 | $47,874 | $8,000 | $39,874 |
| 2018 | $879 | $35,881 | $8,000 | $27,881 |
| 2017 | $764 | $32,491 | $8,000 | $24,491 |
| 2016 | $770 | $32,666 | $8,000 | $24,666 |
| 2015 | $560 | $26,458 | $8,000 | $18,458 |
| 2014 | $519 | $25,232 | $8,000 | $17,232 |
Source: Public Records
Map
Nearby Homes
- 128 Pepperidge Ln
- 120 Pepperidge Ln
- 132 Pepperidge Ln
- 125 Pepperidge Ln
- 121 Pepperidge Ln
- 116 Pepperidge Ln
- 129 Pepperidge Ln
- 185 Derricotte Rd
- 109 Pepperidge Ln
- 133 Pepperidge Ln
- 136 Pepperidge Ln
- 250 Derricotte Rd
- 112 Pepperidge Ln
- 160 Chatham Dr
- 150 Chatham Dr
- 170 Chatham Dr
- 137 Pepperidge Ln
- 140 Chatham Dr
- 140 Pepperidge Ln
- 180 Chatham Dr