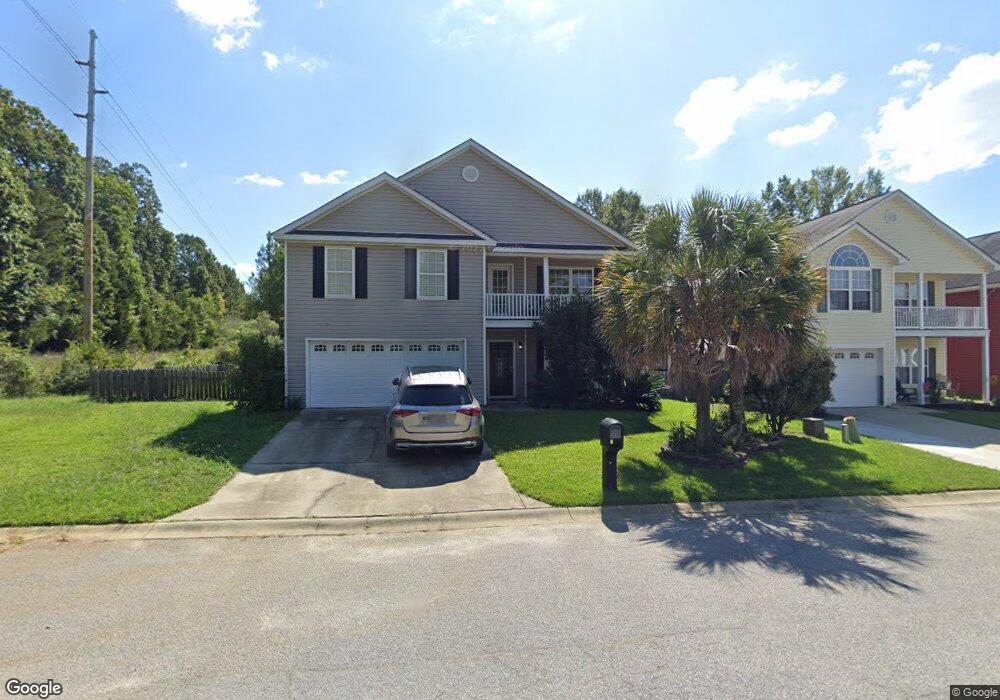
124 Peregrine Ct Chapin, SC 29036
Estimated Value: $256,856 - $275,000
3
Beds
3
Baths
1,776
Sq Ft
$149/Sq Ft
Est. Value
About This Home
This home is located at 124 Peregrine Ct, Chapin, SC 29036 and is currently estimated at $264,464, approximately $148 per square foot. 124 Peregrine Ct is a home located in Lexington County with nearby schools including Lake Murray Elementary School, Chapin Intermediate, and Chapin High School.
Ownership History
Date
Name
Owned For
Owner Type
Purchase Details
Closed on
Aug 31, 2009
Sold by
Priddy Clyde P
Bought by
Woods Kelvin W
Current Estimated Value
Home Financials for this Owner
Home Financials are based on the most recent Mortgage that was taken out on this home.
Original Mortgage
$150,960
Outstanding Balance
$98,476
Interest Rate
5.14%
Mortgage Type
Future Advance Clause Open End Mortgage
Estimated Equity
$165,988
Purchase Details
Closed on
Jul 20, 2007
Sold by
Bb&B Builders Inc
Bought by
Priddy Clyde P
Home Financials for this Owner
Home Financials are based on the most recent Mortgage that was taken out on this home.
Original Mortgage
$134,425
Interest Rate
6.52%
Mortgage Type
Purchase Money Mortgage
Purchase Details
Closed on
Jun 13, 2007
Sold by
Bb&B Builders Inc
Bought by
Priddy Clyde P
Home Financials for this Owner
Home Financials are based on the most recent Mortgage that was taken out on this home.
Original Mortgage
$134,425
Interest Rate
6.52%
Mortgage Type
Purchase Money Mortgage
Create a Home Valuation Report for This Property
The Home Valuation Report is an in-depth analysis detailing your home's value as well as a comparison with similar homes in the area
Home Values in the Area
Average Home Value in this Area
Purchase History
| Date | Buyer | Sale Price | Title Company |
|---|---|---|---|
| Woods Kelvin W | $148,000 | -- | |
| Priddy Clyde P | -- | Attorney | |
| Priddy Clyde P | $141,500 | None Available |
Source: Public Records
Mortgage History
| Date | Status | Borrower | Loan Amount |
|---|---|---|---|
| Open | Woods Kelvin W | $150,960 | |
| Previous Owner | Priddy Clyde P | $134,425 | |
| Previous Owner | Priddy Clyde P | $134,425 |
Source: Public Records
Tax History Compared to Growth
Tax History
| Year | Tax Paid | Tax Assessment Tax Assessment Total Assessment is a certain percentage of the fair market value that is determined by local assessors to be the total taxable value of land and additions on the property. | Land | Improvement |
|---|---|---|---|---|
| 2024 | $987 | $5,990 | $1,158 | $4,832 |
| 2023 | $916 | $5,990 | $1,158 | $4,832 |
| 2022 | $925 | $5,990 | $1,158 | $4,832 |
| 2020 | $968 | $5,990 | $1,158 | $4,832 |
| 2019 | $857 | $5,209 | $600 | $4,609 |
| 2018 | $754 | $5,209 | $600 | $4,609 |
| 2017 | $735 | $5,209 | $600 | $4,609 |
| 2016 | $753 | $5,208 | $600 | $4,608 |
| 2014 | $853 | $5,919 | $800 | $5,119 |
| 2013 | -- | $5,920 | $800 | $5,120 |
Source: Public Records
Map
Nearby Homes
- 153 Rushton Dr
- 228 Bickley View Ct
- 129 Monroe Preserve Dr
- 0 Mainsail Ln Unit 622256
- 171 Elm Creek Dr
- 147 Stuck's Point
- 814 Dutchmaster Dr
- 1431 Saugus Ct
- 357 Chapin Place Way
- 358 Chapin Place Way
- 354 Chapin Place Way
- 338 Chapin Place Way
- 330 Chapin Place Way
- 326 Chapin Place Way
- 720 Topline St
- 366 Gallery Cliff Dr
- 0 Dreher Island Rd Unit 21647709
- 0 Dreher Island Rd Unit 587193
- 444 Dolomite Ct
- 373 Chapin Place Way
- 120 Peregrine Ct
- 116 Peregrine Ct
- 121 Peregrine Ct
- 112 Peregrine Ct
- 117 Peregrine Ct
- 540 Old Bush River Rd
- 538 Old Bush River Rd
- 108 Peregrine Ct
- 113 Peregrine Ct
- 536 Old Bush River Rd
- 109 Peregrine Ct
- 104 Peregrine Ct
- 105 Peregrine Ct
- 532 Old Bush River Rd
- 564 Old Bush River Rd
- 568 Old Bush River Rd Unit B
- 568 Old Bush River Rd
- 568 Old Bush River Rd
- 528 Old Bush River Rd
- 541 Old Bush River Rd