Estimated Value: $197,000 - $250,591
3
Beds
3
Baths
1,840
Sq Ft
$125/Sq Ft
Est. Value
About This Home
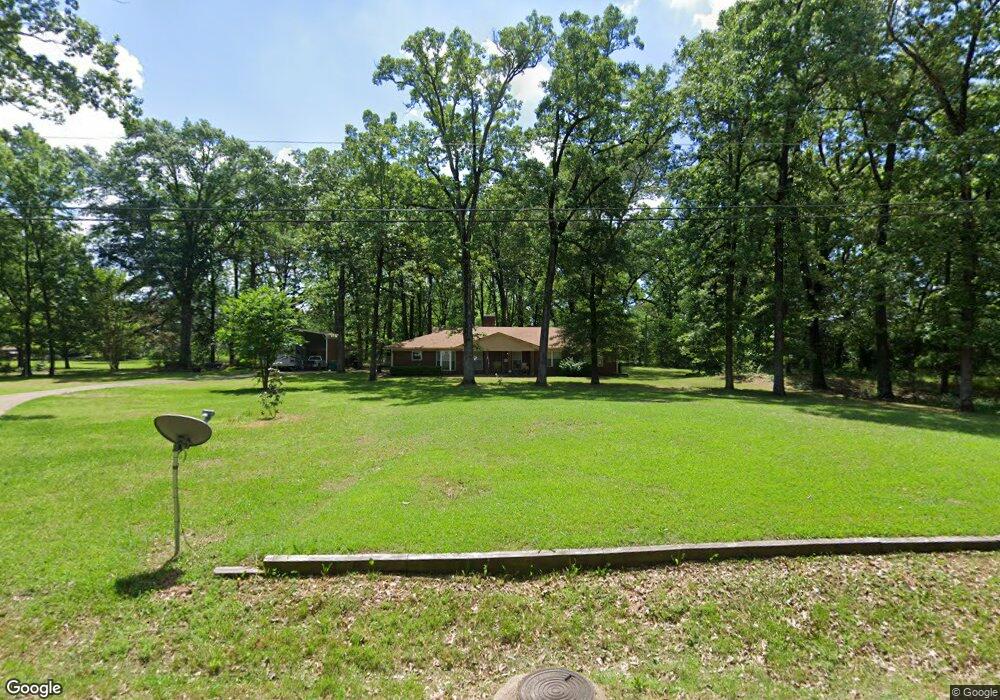
This home is located at 124 Pinehaven Dr, Nash, TX 75569 and is currently estimated at $230,148, approximately $125 per square foot. 124 Pinehaven Dr is a home located in Bowie County with nearby schools including Nash Elementary School, Texas Middle School, and Texas High School.
Ownership History
Date
Name
Owned For
Owner Type
Purchase Details
Closed on
Jul 26, 2019
Sold by
Morris Michael
Bought by
Tramell Ken and Tramell Jovita
Current Estimated Value
Purchase Details
Closed on
Mar 31, 2017
Sold by
Garrett Daniel G and Garrett Colleen B
Bought by
Morris Michael
Purchase Details
Closed on
Jul 19, 2013
Sold by
Weichert Relocation Resources Inc
Bought by
Garrett Daniel G and Garrett Colleen B
Home Financials for this Owner
Home Financials are based on the most recent Mortgage that was taken out on this home.
Original Mortgage
$135,348
Interest Rate
4.29%
Mortgage Type
VA
Purchase Details
Closed on
Apr 30, 2009
Sold by
Davis Gemma
Bought by
Tiwari Housila
Home Financials for this Owner
Home Financials are based on the most recent Mortgage that was taken out on this home.
Original Mortgage
$126,663
Interest Rate
4.77%
Mortgage Type
FHA
Create a Home Valuation Report for This Property
The Home Valuation Report is an in-depth analysis detailing your home's value as well as a comparison with similar homes in the area
Home Values in the Area
Average Home Value in this Area
Purchase History
| Date | Buyer | Sale Price | Title Company |
|---|---|---|---|
| Tramell Ken | -- | Twin City Title | |
| Morris Michael | -- | Twin City Title Company | |
| Garrett Daniel G | -- | None Available | |
| Tiwari Housila | -- | Stewart Title |
Source: Public Records
Mortgage History
| Date | Status | Borrower | Loan Amount |
|---|---|---|---|
| Previous Owner | Garrett Daniel G | $135,348 | |
| Previous Owner | Tiwari Housila | $126,663 |
Source: Public Records
Tax History
| Year | Tax Paid | Tax Assessment Tax Assessment Total Assessment is a certain percentage of the fair market value that is determined by local assessors to be the total taxable value of land and additions on the property. | Land | Improvement |
|---|---|---|---|---|
| 2025 | $974 | $243,540 | -- | -- |
| 2024 | $43 | $218,673 | $15,680 | $214,321 |
| 2023 | $3,950 | $198,794 | $0 | $0 |
| 2022 | $3,717 | $192,584 | $15,680 | $176,904 |
| 2021 | $3,803 | $164,293 | $15,680 | $148,613 |
| 2020 | $3,549 | $157,741 | $15,680 | $142,061 |
| 2019 | $3,774 | $149,323 | $15,680 | $133,643 |
| 2018 | $3,711 | $144,639 | $15,680 | $128,959 |
| 2017 | $3,589 | $142,353 | $15,680 | $126,673 |
| 2016 | $3,589 | $142,353 | $15,680 | $126,673 |
| 2015 | $3,419 | $141,224 | $15,680 | $125,544 |
| 2014 | $3,419 | $136,860 | $15,680 | $121,180 |
Source: Public Records
Map
Nearby Homes
- 18 Kay Cir
- 8 Kay Cir
- 122 Corley Cir
- 173 Corley Cir
- 20 Pecos Place
- 140 Corley Cir
- 0 Brown Cir
- 416 Edgewood Ln
- 303 Peter Alan
- 206 Pine Forest St
- 502 Mitchell Ryan
- 216 Edgewood Cir
- 201 Pine Forest St
- 310 W Greenfield Dr
- 7 Horseshoe Dr
- 105 Eastline Rd
- 311 Loma Linda St
- 208 Trailwood Ln
- 523 Mitchell Ryan
- 220 Johnson St
- 126 Pinehaven Dr
- 120 Pinehaven Dr
- 128 Pinehaven Dr
- 122 Pinehaven Dr
- 123 Pinehaven Dr
- 1024 N Kings Hwy
- 303 Glenway St
- 121 Pinehaven Dr
- 125 Pinehaven Dr
- 119 Pinehaven Dr
- 210 Glenway St
- 208 Glenway St
- 302 Glenway St
- 306 Glenway St
- 1104 N Kings Hwy
- 1031 N Kings Hwy
- 311 Glenway St
- 140 Northwood St
- 1 & 2 Brown Acres
- 207 Glenway St
Your Personal Tour Guide
Ask me questions while you tour the home.