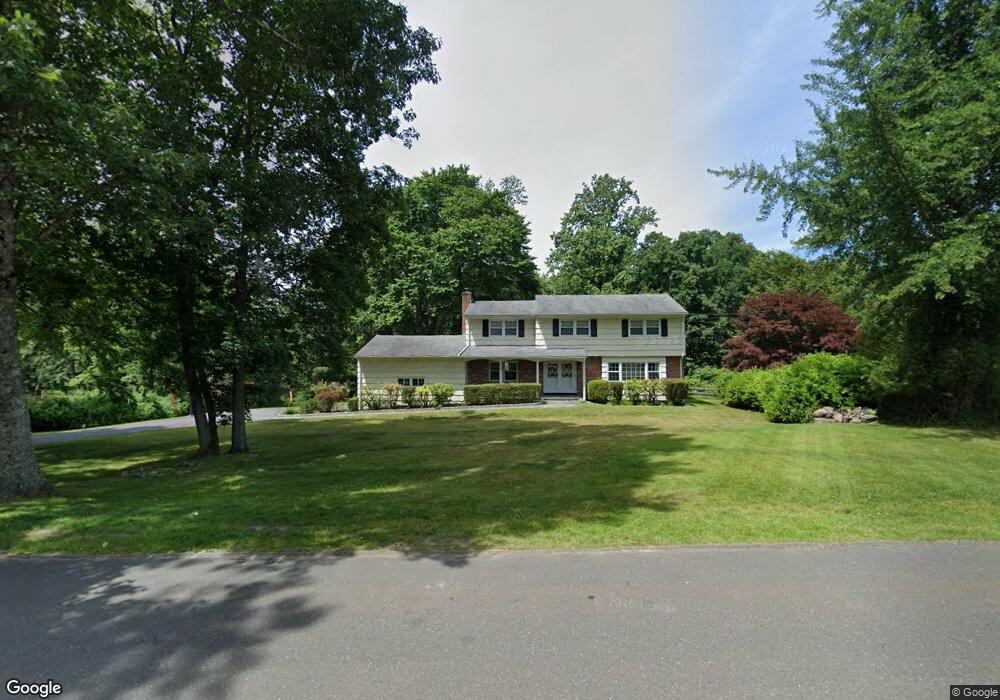
124 Russet Rd Unit 1 Stamford, CT 06903
North Stamford NeighborhoodEstimated Value: $913,000 - $1,091,854
4
Beds
3
Baths
2,379
Sq Ft
$434/Sq Ft
Est. Value
About This Home
This home is located at 124 Russet Rd Unit 1, Stamford, CT 06903 and is currently estimated at $1,032,714, approximately $434 per square foot. 124 Russet Rd Unit 1 is a home located in Fairfield County with nearby schools including Northeast Elementary School, Turn of River School, and Westhill High School.
Ownership History
Date
Name
Owned For
Owner Type
Purchase Details
Closed on
Aug 23, 2019
Sold by
Baker Christopher J and Baker Karen A
Bought by
Scherban David S and Scherban Rachel L
Current Estimated Value
Home Financials for this Owner
Home Financials are based on the most recent Mortgage that was taken out on this home.
Original Mortgage
$560,000
Outstanding Balance
$491,461
Interest Rate
3.8%
Mortgage Type
Purchase Money Mortgage
Estimated Equity
$541,253
Purchase Details
Closed on
May 11, 2006
Sold by
Garcia Carl and Garcia Elena
Bought by
Baker Karen A
Purchase Details
Closed on
Jun 15, 2001
Sold by
Welch Paul X and Welch Arlena
Bought by
Garcia Carl and Garcia Elena
Purchase Details
Closed on
Mar 21, 1997
Sold by
Fried Ira and Fried Joy B
Bought by
Welch Paul X and Tabora Arlena
Purchase Details
Closed on
Nov 5, 1991
Sold by
Levy Judith
Bought by
Fried Ira and Fried Joy
Create a Home Valuation Report for This Property
The Home Valuation Report is an in-depth analysis detailing your home's value as well as a comparison with similar homes in the area
Home Values in the Area
Average Home Value in this Area
Purchase History
| Date | Buyer | Sale Price | Title Company |
|---|---|---|---|
| Scherban David S | $660,000 | -- | |
| Baker Karen A | $805,000 | -- | |
| Garcia Carl | $583,000 | -- | |
| Welch Paul X | $350,000 | -- | |
| Fried Ira | $327,500 | -- |
Source: Public Records
Mortgage History
| Date | Status | Borrower | Loan Amount |
|---|---|---|---|
| Open | Scherban David S | $560,000 | |
| Previous Owner | Fried Ira | $200,000 | |
| Previous Owner | Fried Ira | $250,000 |
Source: Public Records
Tax History Compared to Growth
Tax History
| Year | Tax Paid | Tax Assessment Tax Assessment Total Assessment is a certain percentage of the fair market value that is determined by local assessors to be the total taxable value of land and additions on the property. | Land | Improvement |
|---|---|---|---|---|
| 2025 | $12,852 | $552,310 | $255,450 | $296,860 |
| 2024 | $12,571 | $552,310 | $255,450 | $296,860 |
| 2023 | $13,510 | $552,310 | $255,450 | $296,860 |
| 2022 | $11,727 | $445,370 | $193,520 | $251,850 |
| 2021 | $10,618 | $408,840 | $193,520 | $215,320 |
| 2020 | $10,356 | $408,840 | $193,520 | $215,320 |
| 2019 | $10,356 | $408,840 | $193,520 | $215,320 |
| 2018 | $9,996 | $408,840 | $193,520 | $215,320 |
| 2017 | $10,811 | $402,050 | $201,940 | $200,110 |
| 2016 | $9,979 | $402,050 | $201,940 | $200,110 |
| 2015 | $9,705 | $402,050 | $201,940 | $200,110 |
| 2014 | $9,372 | $402,050 | $201,940 | $200,110 |
Source: Public Records
Map
Nearby Homes
- 65 Mcintosh Rd
- 27 Briar Brae Rd
- 342 Mayapple Rd
- 236 Briar Brae Rd
- 0 Rock Rimmon Rd Unit LOT 18 24073521
- 518 Woodbine Rd
- 501 Woodbine Rd
- 27 Golden Farm Rd
- 125 Saddle Hill Rd
- 1580 Ponus Ridge
- 22 Blackberry Dr E
- 250 Saddle Hill Rd
- 239 E Hunting Ridge Rd
- 40 Hoyclo Rd
- 0 Rolling Meadow Ln Unit ONEH6302491
- 1287 Rock Rimmon Rd
- 19 Thornwood Rd
- 37 Pinner Ln
- 26 Pequot Ln
- 43 Mill Rd
- 124 Russet Rd Unit RNTL
- 124 Russet Rd
- 138 Russet Rd
- 106 Russet Rd
- 117 Russet Rd
- 141 Russet Rd
- 152 Russet Rd
- 44 Crab Apple Place
- 48 Crab Apple Place
- 101 Russet Rd
- 90 Russet Rd
- 48 Black Twig Place
- 153 Russet Rd
- 20 Flora Place
- 52 Black Twig Place
- 87 Russet Rd
- 37 Crab Apple Place
- 42 Black Twig Place
- 40 Crab Apple Place
- 2828 High Ridge Rd