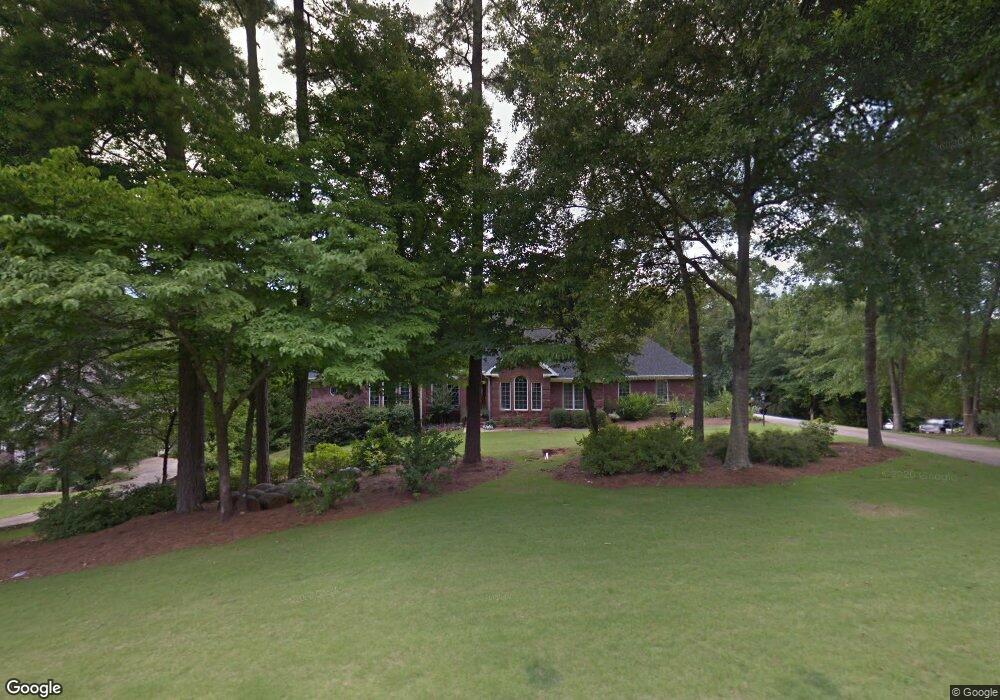
124 Sunny Point Cir Unit 13 Lagrange, GA 30240
Estimated Value: $634,000 - $835,000
4
Beds
4
Baths
3,410
Sq Ft
$217/Sq Ft
Est. Value
About This Home
This home is located at 124 Sunny Point Cir Unit 13, Lagrange, GA 30240 and is currently estimated at $740,296, approximately $217 per square foot. 124 Sunny Point Cir Unit 13 is a home located in Troup County with nearby schools including Franklin Forest Elementary School, Hollis Hand Elementary School, and Ethel W. Kight Elementary School.
Ownership History
Date
Name
Owned For
Owner Type
Purchase Details
Closed on
Jul 12, 2023
Sold by
Bruce Allen K
Bought by
Douglas Raymond and Douglas Lisa
Current Estimated Value
Purchase Details
Closed on
May 13, 2016
Sold by
Waters Reena M
Bought by
Bruce Allen K and Bruce Martha L
Home Financials for this Owner
Home Financials are based on the most recent Mortgage that was taken out on this home.
Original Mortgage
$343,500
Interest Rate
3.58%
Mortgage Type
New Conventional
Purchase Details
Closed on
Oct 17, 1994
Sold by
Davis O B
Bought by
Franklin Waters
Purchase Details
Closed on
Dec 1, 1988
Sold by
O B and Virginia Davis
Bought by
Davis O B
Purchase Details
Closed on
Jan 1, 1964
Bought by
O B and Virginia Davis
Create a Home Valuation Report for This Property
The Home Valuation Report is an in-depth analysis detailing your home's value as well as a comparison with similar homes in the area
Home Values in the Area
Average Home Value in this Area
Purchase History
| Date | Buyer | Sale Price | Title Company |
|---|---|---|---|
| Douglas Raymond | $685,500 | -- | |
| Bruce Allen K | $375,000 | -- | |
| Franklin Waters | $43,000 | -- | |
| Davis O B | -- | -- | |
| O B | -- | -- |
Source: Public Records
Mortgage History
| Date | Status | Borrower | Loan Amount |
|---|---|---|---|
| Previous Owner | Bruce Allen K | $343,500 |
Source: Public Records
Tax History Compared to Growth
Tax History
| Year | Tax Paid | Tax Assessment Tax Assessment Total Assessment is a certain percentage of the fair market value that is determined by local assessors to be the total taxable value of land and additions on the property. | Land | Improvement |
|---|---|---|---|---|
| 2024 | $7,048 | $258,440 | $38,000 | $220,440 |
| 2023 | $3,516 | $34,111 | $0 | $34,111 |
| 2022 | $3,957 | $143,756 | $27,000 | $116,756 |
| 2021 | $4,357 | $146,436 | $27,000 | $119,436 |
| 2020 | $4,357 | $146,436 | $27,000 | $119,436 |
| 2019 | $4,080 | $137,280 | $26,000 | $111,280 |
| 2018 | $4,080 | $137,280 | $26,000 | $111,280 |
| 2017 | $3,505 | $136,720 | $21,280 | $115,440 |
| 2016 | $3,408 | $114,982 | $21,280 | $93,702 |
| 2015 | $3,414 | $114,982 | $21,280 | $93,702 |
| 2014 | $3,361 | $113,050 | $21,280 | $91,770 |
| 2013 | -- | $114,448 | $21,280 | $93,168 |
Source: Public Records
Map
Nearby Homes
- 129 Sunny Point Cir
- 117 Woodchase
- 107 Windridge
- 109 Windridge
- 118 Moss Creek Dr
- LOT 106 River Oaks Dr
- 209 River Oaks Dr
- 105 Ridgeview Dr
- 104 Hidden Branches Ln
- 127 Oakmont Dr
- 127 Ashling Dr
- 91 Richmond Dr
- 1784 New Franklin Rd
- 0 Waterview Dr Unit LOT 34 10500921
- 0 Waterview Dr Unit LOT 37 & 27B
- 0 Waterview Dr Unit 10580887
- 0 Waterview Dr Unit LOT 31 10491353
- 0 Waterview Dr Unit LOT 30 10491028
- 0 Waterview Dr Unit 10554814
- 0 Waterview Dr Unit 10558462
- 124 Sunny Point Cir
- 122 Sunny Point Cir
- 126 Sunny Point Cir
- 0 Sunny Point Unit 3233333
- 0 Sunny Point Unit 8982828
- 121 Sunny Point Cir
- 118 Sunny Point Cir
- 128 Sunny Point Cir
- 116 Sunny Point Cir
- 115 Sunny Point Cir
- 130 Sunny Point Cir
- 131 Sunny Point Cir
- 107 Woodchase
- 114 Sunny Point Cir
- 105 Woodchase
- 111 Woodchase
- 113 Sunny Point Cir
- 113 Sunny Point
- 133 Sunny Point Cir
- 132 Sunny Point Cir