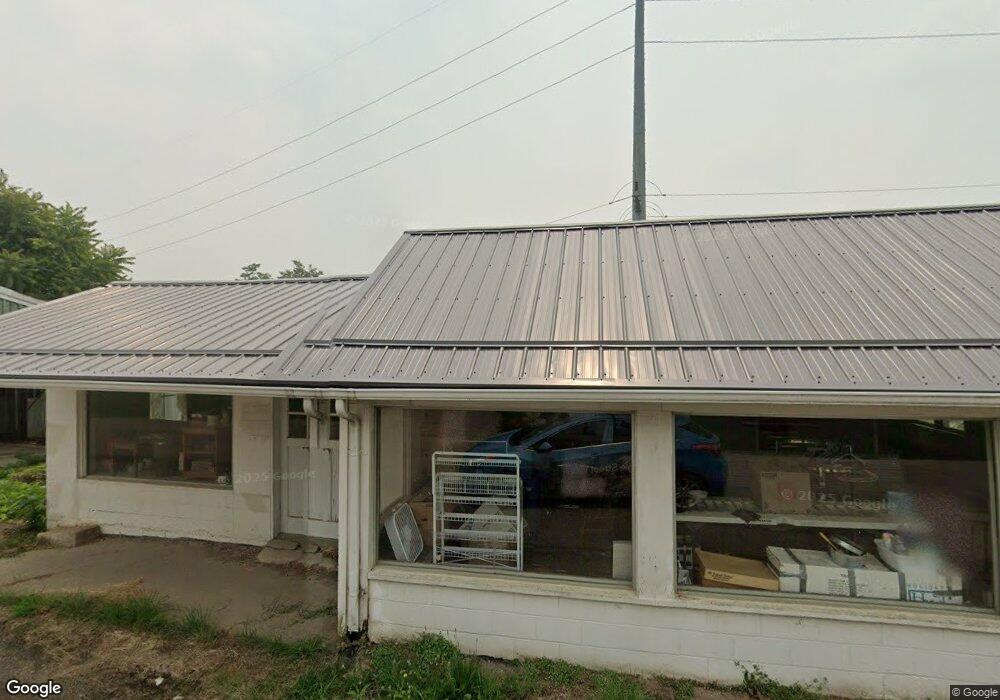
124 Sycamore St Barnesville, OH 43713
Estimated Value: $43,000
Studio
--
Bath
2,892
Sq Ft
$15/Sq Ft
Est. Value
About This Home
This home is located at 124 Sycamore St, Barnesville, OH 43713 and is currently estimated at $43,000, approximately $14 per square foot. 124 Sycamore St is a home located in Belmont County with nearby schools including Barnesville Elementary School, Barnesville Middle School, and Barnesville High School.
Ownership History
Date
Name
Owned For
Owner Type
Purchase Details
Closed on
Dec 2, 2014
Sold by
Stephen Kimberly K and Mclaughlin Nancy J
Bought by
Mcgee Daniel L and Mcgee Beth A
Current Estimated Value
Purchase Details
Closed on
Apr 19, 2008
Sold by
Kemp Richard M
Bought by
Hannahs Lance R and Hannahs Ashley N
Purchase Details
Closed on
May 21, 2003
Sold by
Kemp Richard M
Bought by
Kemp Richard M
Purchase Details
Closed on
May 13, 2003
Sold by
Moore Beverly
Bought by
Moore Beverly
Purchase Details
Closed on
Nov 21, 2002
Sold by
Reed Stanley and Mo Beverly
Bought by
Reed Stanley and Beverly Mo
Purchase Details
Closed on
Mar 7, 2002
Bought by
Toohey Betty Ann Etal 3
Purchase Details
Closed on
Oct 31, 2001
Bought by
Toohey Betty Ann Etal 3
Purchase Details
Closed on
Jan 1, 1986
Sold by
Howell Beatrice L
Bought by
Howell Beatrice L
Create a Home Valuation Report for This Property
The Home Valuation Report is an in-depth analysis detailing your home's value as well as a comparison with similar homes in the area
Home Values in the Area
Average Home Value in this Area
Purchase History
| Date | Buyer | Sale Price | Title Company |
|---|---|---|---|
| Mcgee Daniel L | $45,000 | Attorney | |
| Mcgee Daniel L | $5,000 | Attorney | |
| Hannahs Lance R | $85,000 | Attorney | |
| Kemp Richard M | $120,000 | -- | |
| Moore Beverly | -- | -- | |
| Reed Stanley | $110,000 | -- | |
| Toohey Betty Ann Etal 3 | -- | -- | |
| Toohey Betty Ann Etal 3 | -- | -- | |
| Howell Beatrice L | -- | -- |
Source: Public Records
Tax History
| Year | Tax Paid | Tax Assessment Tax Assessment Total Assessment is a certain percentage of the fair market value that is determined by local assessors to be the total taxable value of land and additions on the property. | Land | Improvement |
|---|---|---|---|---|
| 2025 | $320 | $9,480 | $680 | $8,800 |
| 2024 | $316 | $9,480 | $680 | $8,800 |
| 2023 | $250 | $7,190 | $710 | $6,480 |
| 2022 | $250 | $7,188 | $710 | $6,478 |
| 2021 | $251 | $7,188 | $710 | $6,478 |
| 2020 | $218 | $5,990 | $590 | $5,400 |
| 2019 | $221 | $5,990 | $590 | $5,400 |
| 2018 | $227 | $5,990 | $590 | $5,400 |
| 2017 | $235 | $6,260 | $3,260 | $3,000 |
| 2016 | $224 | $6,260 | $3,260 | $3,000 |
| 2015 | $224 | $6,260 | $3,260 | $3,000 |
| 2014 | $247 | $6,810 | $2,960 | $3,850 |
| 2013 | $239 | $6,810 | $2,960 | $3,850 |
Source: Public Records
Map
Nearby Homes
- 329 S Chestnut St
- 152 E Main St
- 136 E Walnut St
- TBD W Main St
- 613 E Main St
- 618 Park St
- 174 Pine Ln
- 105 Bethesda St
- 118 Pine Ln
- 61900 Fairview Rd
- 0 County Road 114
- 0 Fairmont Ave Unit 5163774
- 0 Fairmont Ave Unit 5163784
- 62239 Hillcrest Rd
- 0 Nevada Rd
- 57128 Somerton Hwy
- Lot 1 Cattle Dr
- 0 Greenlawn Rd Unit 3
- 0 Greenlawn Rd Unit 2
- 0 Greenlawn Rd Unit 4
- 119 Sycamore St
- 127 Sycamore St
- 128 Sycamore St
- 619 S Chestnut St
- 615 S Chestnut St
- 122 Grandview Ave
- 130 Grandview Ave
- 204 Sycamore St
- 204 Sycamore St
- 114 Grandview Ave
- 612 Leggett Ave
- 201 Sycamore St
- 0 Sycamore St Unit 4469045
- 216 Sycamore St
- 624 S Chestnut St
- 601 S Chestnut St
- 191 Grandview Ave
- 206 Sycamore St
- 208 Carl St
- 610 S Chestnut St