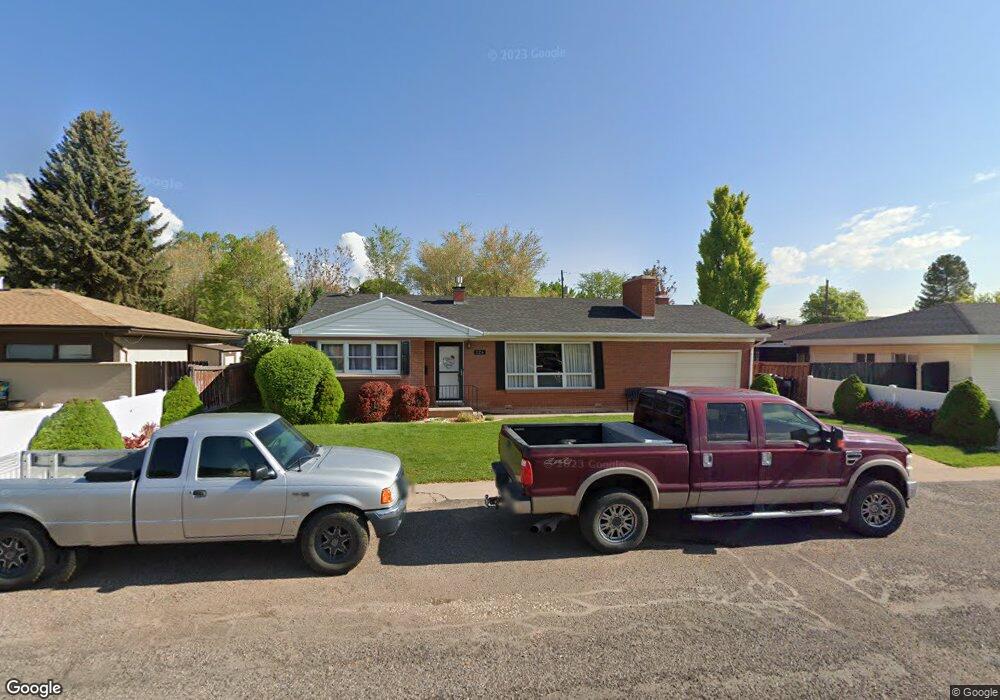
124 W 600 N Richfield, UT 84701
Estimated Value: $305,000 - $352,000
3
Beds
1
Bath
1,846
Sq Ft
$177/Sq Ft
Est. Value
About This Home
This home is located at 124 W 600 N, Richfield, UT 84701 and is currently estimated at $326,425, approximately $176 per square foot. 124 W 600 N is a home located in Sevier County with nearby schools including Pahvant School, Ashman School, and Red Hills Middle School.
Ownership History
Date
Name
Owned For
Owner Type
Purchase Details
Closed on
May 9, 2024
Sold by
Hansen Brock and Hansen Mandy
Bought by
Torgenson Michael Tyler
Current Estimated Value
Purchase Details
Closed on
Oct 26, 2010
Sold by
Ogden Diana
Bought by
Hansen Brock and Hansen Mandy
Home Financials for this Owner
Home Financials are based on the most recent Mortgage that was taken out on this home.
Original Mortgage
$136,620
Interest Rate
4.31%
Mortgage Type
New Conventional
Create a Home Valuation Report for This Property
The Home Valuation Report is an in-depth analysis detailing your home's value as well as a comparison with similar homes in the area
Home Values in the Area
Average Home Value in this Area
Purchase History
| Date | Buyer | Sale Price | Title Company |
|---|---|---|---|
| Torgenson Michael Tyler | -- | First American Title | |
| Hansen Brock | -- | -- |
Source: Public Records
Mortgage History
| Date | Status | Borrower | Loan Amount |
|---|---|---|---|
| Previous Owner | Hansen Brock | $136,620 |
Source: Public Records
Tax History Compared to Growth
Tax History
| Year | Tax Paid | Tax Assessment Tax Assessment Total Assessment is a certain percentage of the fair market value that is determined by local assessors to be the total taxable value of land and additions on the property. | Land | Improvement |
|---|---|---|---|---|
| 2024 | $1,487 | $150,321 | $31,700 | $118,621 |
| 2023 | $1,579 | $157,914 | $29,327 | $128,587 |
| 2022 | $1,493 | $136,352 | $24,474 | $111,878 |
| 2021 | $1,427 | $109,672 | $25,629 | $84,043 |
| 2020 | $1,311 | $97,931 | $19,800 | $78,131 |
| 2019 | $1,119 | $88,500 | $16,500 | $72,000 |
| 2018 | $1,110 | $78,690 | $16,500 | $62,190 |
| 2017 | $1,073 | $72,560 | $16,500 | $56,060 |
| 2016 | $861 | $72,560 | $0 | $0 |
| 2015 | $861 | $66,890 | $0 | $0 |
| 2014 | $861 | $63,870 | $0 | $0 |
Source: Public Records
Map
Nearby Homes