Estimated Value: $7,677,000 - $35,828,492
7
Beds
9
Baths
6,917
Sq Ft
$3,145/Sq Ft
Est. Value
About This Home
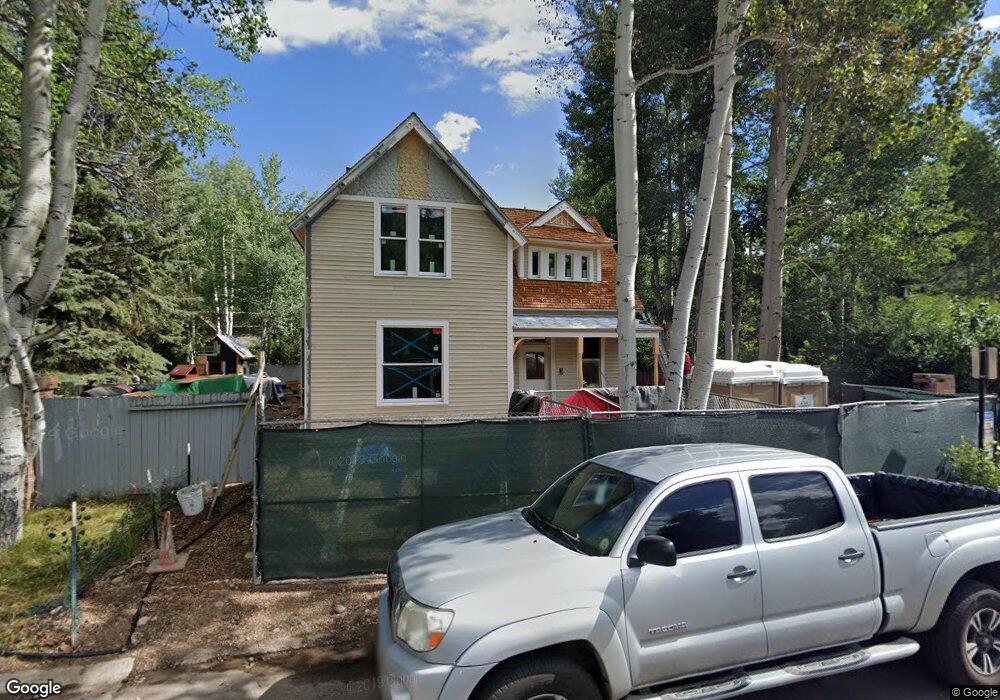
This home is located at 124 W Hallam St Unit PLUS LOT, Aspen, CO 81611 and is currently estimated at $21,752,746, approximately $3,144 per square foot. 124 W Hallam St Unit PLUS LOT is a home located in Pitkin County with nearby schools including Aspen Elementary School, Aspen Middle School, and Aspen High School.
Ownership History
Date
Name
Owned For
Owner Type
Purchase Details
Closed on
Oct 8, 2020
Sold by
308 Aspen Holding Company Llc
Bought by
Todd And Kasey Lemin Trust
Current Estimated Value
Home Financials for this Owner
Home Financials are based on the most recent Mortgage that was taken out on this home.
Original Mortgage
$13,797,000
Outstanding Balance
$9,916,393
Interest Rate
2.9%
Mortgage Type
New Conventional
Estimated Equity
$11,836,353
Purchase Details
Closed on
Nov 2, 2016
Sold by
Aspen E Llc
Bought by
308 Aspen Holding Company Llc
Purchase Details
Closed on
Aug 17, 2015
Sold by
Dtj Legacy Properties Llc
Bought by
308 Aspen E Llc
Purchase Details
Closed on
Jul 16, 2012
Sold by
Landen Diane Nolan and Nolan William C
Bought by
Landen Diane Nolan and Nolan William C
Create a Home Valuation Report for This Property
The Home Valuation Report is an in-depth analysis detailing your home's value as well as a comparison with similar homes in the area
Home Values in the Area
Average Home Value in this Area
Purchase History
| Date | Buyer | Sale Price | Title Company |
|---|---|---|---|
| Todd And Kasey Lemin Trust | $22,995,000 | None Available | |
| 308 Aspen Holding Company Llc | -- | None Available | |
| 308 Aspen E Llc | $4,200,000 | None Available | |
| Landen Diane Nolan | -- | None Available |
Source: Public Records
Mortgage History
| Date | Status | Borrower | Loan Amount |
|---|---|---|---|
| Open | Todd And Kasey Lemin Trust | $13,797,000 |
Source: Public Records
Tax History Compared to Growth
Tax History
| Year | Tax Paid | Tax Assessment Tax Assessment Total Assessment is a certain percentage of the fair market value that is determined by local assessors to be the total taxable value of land and additions on the property. | Land | Improvement |
|---|---|---|---|---|
| 2024 | $66,006 | $2,007,790 | $501,580 | $1,506,210 |
| 2023 | $66,006 | $2,029,970 | $507,120 | $1,522,850 |
| 2022 | $42,136 | $1,149,300 | $312,750 | $836,550 |
| 2021 | $41,954 | $1,182,370 | $321,750 | $860,620 |
| 2020 | $34,148 | $955,800 | $300,300 | $655,500 |
| 2019 | $15,828 | $443,030 | $300,300 | $142,730 |
| 2018 | $11,276 | $446,130 | $302,400 | $143,730 |
| 2017 | $11,564 | $363,590 | $280,800 | $82,790 |
| 2016 | $10,909 | $335,940 | $254,720 | $81,220 |
| 2015 | $10,768 | $335,940 | $254,720 | $81,220 |
| 2014 | $10,627 | $316,840 | $238,800 | $78,040 |
Source: Public Records
Map
Nearby Homes
- 115 W Bleeker St
- 109 W Bleeker St
- 103 W Bleeker St
- 122 W Main St
- 220 W Main St Unit 210/ P1/ B6
- 211 W Main St
- 333 W Main St Unit B2
- 437 W Smuggler St
- 227 E Main St
- 124 W Hyman Ave Unit 3B
- 333 W Hopkins Ave
- 503 W Main St Unit B202
- 411 Pearl Ct
- 125 E Hyman Ave Unit 1
- 947 TBD W Smuggler St
- 605 W Bleeker St
- 433 W Gillespie St
- 612 W Francis St
- 210 E Cooper Ave Unit 3E
- 210 E Cooper Ave Unit 3G
- 124 W Hallam St
- 308 N 1st St
- 308 N 1st St
- 100 W Hallam St
- 129 W Francis St
- 123 W Francis St
- 135 W Francis St
- 111 W Francis St
- 101 W Francis St
- 200 W Hallam St
- 201 W Francis St
- 201 W Hallam St
- 220 W Hallam St
- 120 W Francis St
- 224 W Hallam St
- 224 W Hallam St Unit 1
- 410 N 1st St
- 215 W Francis St
- 101 E Hallam St
- 202 W Francis St