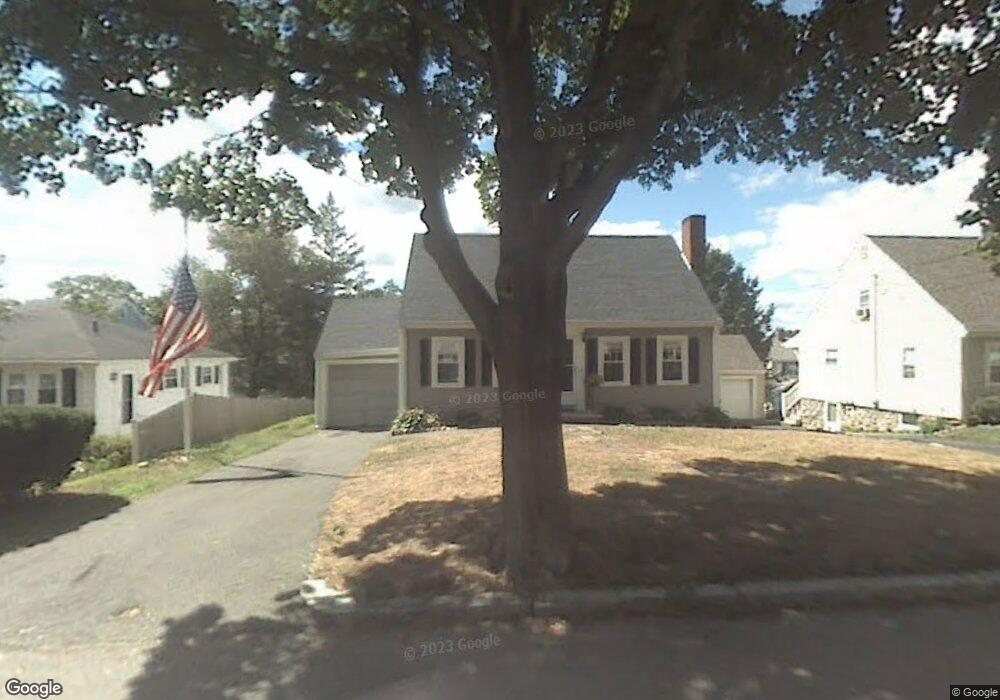
124 Whitman Ave Melrose, MA 02176
Melrose East Side NeighborhoodEstimated Value: $719,000 - $939,747
4
Beds
2
Baths
1,638
Sq Ft
$530/Sq Ft
Est. Value
About This Home
This home is located at 124 Whitman Ave, Melrose, MA 02176 and is currently estimated at $868,937, approximately $530 per square foot. 124 Whitman Ave is a home located in Middlesex County with nearby schools including Winthrop Elementary School, Hoover Elementary School, and Lincoln Elementary School.
Ownership History
Date
Name
Owned For
Owner Type
Purchase Details
Closed on
Jul 23, 2004
Sold by
Mahoney John L and Mahoney Karen P
Bought by
Walsh Alicia Henry and Walsh Christopher J
Current Estimated Value
Home Financials for this Owner
Home Financials are based on the most recent Mortgage that was taken out on this home.
Original Mortgage
$352,000
Interest Rate
6.28%
Mortgage Type
Purchase Money Mortgage
Purchase Details
Closed on
Aug 31, 1993
Sold by
Duffy Gertrude M
Bought by
Mahoney John L and Mahoney Karen P
Create a Home Valuation Report for This Property
The Home Valuation Report is an in-depth analysis detailing your home's value as well as a comparison with similar homes in the area
Home Values in the Area
Average Home Value in this Area
Purchase History
| Date | Buyer | Sale Price | Title Company |
|---|---|---|---|
| Walsh Alicia Henry | $441,000 | -- | |
| Mahoney John L | $157,500 | -- |
Source: Public Records
Mortgage History
| Date | Status | Borrower | Loan Amount |
|---|---|---|---|
| Open | Mahoney John L | $323,000 | |
| Closed | Walsh Alicia Henry | $352,000 | |
| Previous Owner | Mahoney John L | $8,671 | |
| Previous Owner | Mahoney John L | $10,000 |
Source: Public Records
Tax History Compared to Growth
Tax History
| Year | Tax Paid | Tax Assessment Tax Assessment Total Assessment is a certain percentage of the fair market value that is determined by local assessors to be the total taxable value of land and additions on the property. | Land | Improvement |
|---|---|---|---|---|
| 2025 | $78 | $785,100 | $479,400 | $305,700 |
| 2024 | $7,547 | $760,000 | $465,700 | $294,300 |
| 2023 | $7,600 | $729,400 | $452,000 | $277,400 |
| 2022 | $7,176 | $678,900 | $411,000 | $267,900 |
| 2021 | $6,958 | $635,400 | $383,600 | $251,800 |
| 2020 | $7,021 | $635,400 | $383,600 | $251,800 |
| 2019 | $6,115 | $565,700 | $342,500 | $223,200 |
| 2018 | $5,866 | $517,700 | $294,500 | $223,200 |
| 2017 | $5,640 | $478,000 | $274,000 | $204,000 |
| 2016 | $5,759 | $467,100 | $274,000 | $193,100 |
| 2015 | $5,564 | $429,300 | $260,300 | $169,000 |
| 2014 | $5,337 | $401,900 | $232,900 | $169,000 |
Source: Public Records
Map
Nearby Homes
- 30 Wheeler Ave
- 42 Fairfield Ave
- 218 Upham St
- 65 Beacon St
- 257 1st St
- 58 Summer St
- 27 Temple St
- 31 Temple St
- 16-18 Beacon Place
- 11 Church St
- 33 Mount Hood Terrace
- 1 Mill Rd
- 36 Slayton Rd
- 333 Main St
- 0 S Mountain Avenue & O Cargil
- 12 Mount Vernon St Unit 27
- 16 Plymouth Cir
- 20 Herbert St
- 55 Burrell St
- 17 Swains Pond Ave