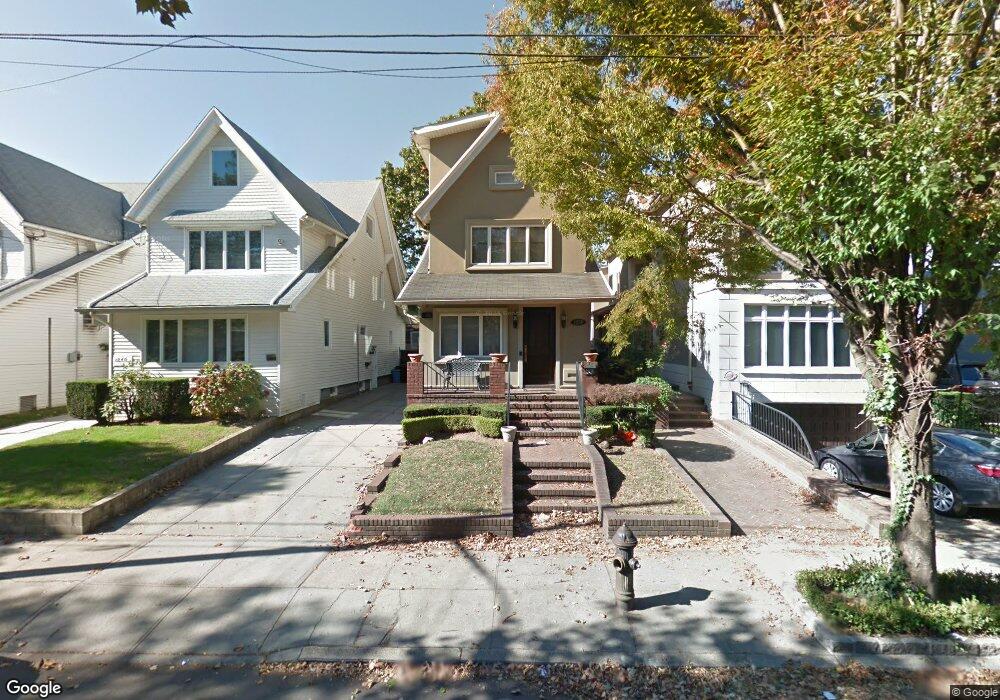
1240 E 26th St Brooklyn, NY 11210
Midwood NeighborhoodEstimated Value: $1,378,000 - $1,535,000
Studio
--
Bath
1,480
Sq Ft
$995/Sq Ft
Est. Value
About This Home
This home is located at 1240 E 26th St, Brooklyn, NY 11210 and is currently estimated at $1,473,309, approximately $995 per square foot. 1240 E 26th St is a home located in Kings County with nearby schools including P.S. 193 Gil Hodges, Andries Hudde School, and Shaare Torah High School-Girls.
Ownership History
Date
Name
Owned For
Owner Type
Purchase Details
Closed on
Jul 2, 2020
Sold by
Fried Asher and Fried Elina
Bought by
Asher Fried Trustee and Elina Fried Trustee
Current Estimated Value
Purchase Details
Closed on
Sep 18, 2017
Sold by
Wiedermann Menachem and Wiedermann Toby
Bought by
Fried Asher and Fried Elina
Home Financials for this Owner
Home Financials are based on the most recent Mortgage that was taken out on this home.
Original Mortgage
$770,000
Interest Rate
3.9%
Mortgage Type
Purchase Money Mortgage
Purchase Details
Closed on
Jul 4, 2012
Sold by
Wiedermann Menachem and Wiedermann Toby Kohn
Bought by
Wiedermann Menachem and Wiedermann Toby
Purchase Details
Closed on
Oct 9, 2003
Sold by
Cohen Leonard D
Bought by
Kohn Wiedermann Toby and Wiedermann Menachem
Home Financials for this Owner
Home Financials are based on the most recent Mortgage that was taken out on this home.
Original Mortgage
$425,000
Interest Rate
5.89%
Mortgage Type
Purchase Money Mortgage
Create a Home Valuation Report for This Property
The Home Valuation Report is an in-depth analysis detailing your home's value as well as a comparison with similar homes in the area
Home Values in the Area
Average Home Value in this Area
Purchase History
| Date | Buyer | Sale Price | Title Company |
|---|---|---|---|
| Asher Fried Trustee | -- | -- | |
| Asher Fried Trustee | -- | -- | |
| Asher Fried Trustee | -- | -- | |
| Fried Asher | $1,350,000 | -- | |
| Fried Asher | $1,350,000 | -- | |
| Fried Asher | $1,350,000 | -- | |
| Wiedermann Menachem | -- | -- | |
| Wiedermann Menachem | -- | -- | |
| Kohn Wiedermann Toby | -- | -- | |
| Kohn Wiedermann Toby | -- | -- |
Source: Public Records
Mortgage History
| Date | Status | Borrower | Loan Amount |
|---|---|---|---|
| Previous Owner | Fried Asher | $770,000 | |
| Previous Owner | Kohn Wiedermann Toby | $425,000 |
Source: Public Records
Tax History
| Year | Tax Paid | Tax Assessment Tax Assessment Total Assessment is a certain percentage of the fair market value that is determined by local assessors to be the total taxable value of land and additions on the property. | Land | Improvement |
|---|---|---|---|---|
| 2025 | $10,795 | $78,120 | $22,080 | $56,040 |
| 2024 | $10,795 | $82,920 | $22,080 | $60,840 |
| 2023 | $10,327 | $74,280 | $22,080 | $52,200 |
| 2022 | $9,577 | $61,320 | $22,080 | $39,240 |
| 2021 | $9,991 | $62,100 | $22,080 | $40,020 |
| 2020 | $4,686 | $68,760 | $22,080 | $46,680 |
| 2019 | $9,369 | $76,020 | $22,080 | $53,940 |
| 2018 | $8,638 | $42,374 | $13,226 | $29,148 |
| 2017 | $7,850 | $39,978 | $12,916 | $27,062 |
| 2016 | $7,599 | $39,563 | $14,458 | $25,105 |
| 2015 | $4,329 | $37,324 | $16,980 | $20,344 |
| 2014 | $4,329 | $37,324 | $20,381 | $16,943 |
Source: Public Records
Map
Nearby Homes
- 1213 E 23rd St
- 1333 E 26th St
- 3453 Bedford Ave
- 2112 Avenue L
- 1344 E 28th St
- 2318 Avenue K
- 2525 Nostrand Ave Unit 5S
- 2525 Nostrand Ave Unit 7E
- 2525 Nostrand Ave Unit 2R
- 1239 E 31st St
- 1773 Ocean Ave
- 1801 Ocean Ave Unit 5F
- 1680 Ocean Ave Unit 6A
- 1251 E 19th St Unit 6B
- 1426 E 28th St
- 1117 E 31st St
- 2114 Avenue N
- 1916 Avenue K Unit 1E
- 2234 Olean St
- 3206 Avenue K
- 1238 E 26th St
- 1244 E 26th St
- 1234 E 26th St
- 1248 E 26th St Unit 1250
- 1248-1250 E 26th St
- 1230 E 26th St
- 3355 Bedford Ave
- 1252 E 26th St
- 3353 Bedford Ave
- 3359 Bedford Ave Unit 3361
- 3359-3361 Bedford Ave
- 3349 Bedford Ave
- 3365 Bedford Ave
- 1226 E 26th St
- 3347 Bedford Ave
- 3367 Bedford Ave
- 1256 E 26th St
- 3343 Bedford Ave
- 1220 E 26th St
- 1237 E 26th St
Your Personal Tour Guide
Ask me questions while you tour the home.