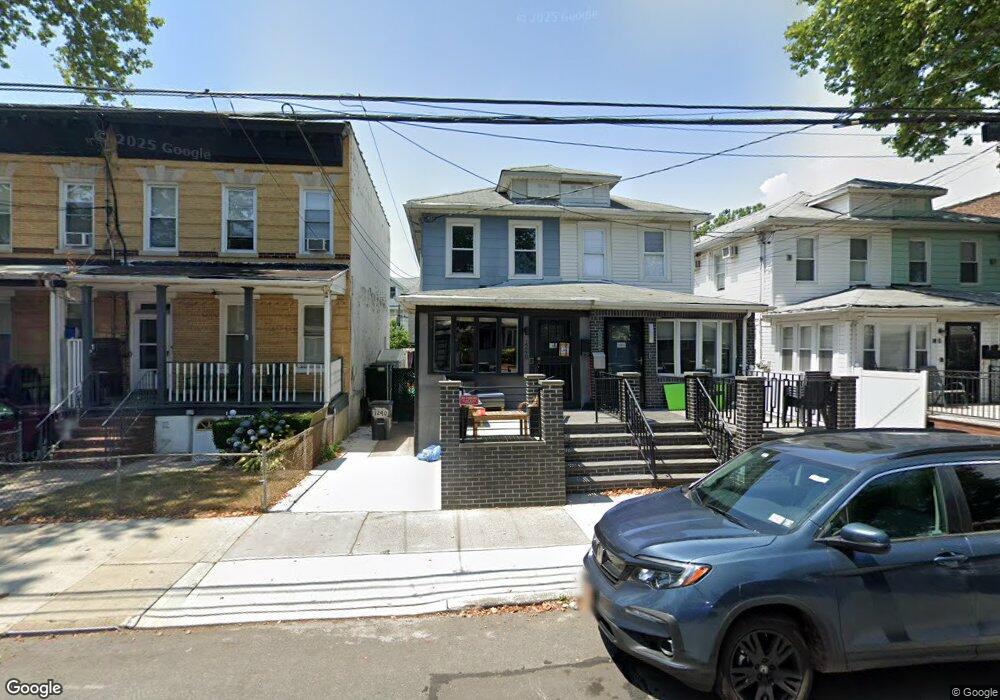
1240 E 34th St Brooklyn, NY 11210
Flatlands NeighborhoodEstimated Value: $785,017 - $1,032,000
Studio
--
Bath
1,261
Sq Ft
$728/Sq Ft
Est. Value
About This Home
This home is located at 1240 E 34th St, Brooklyn, NY 11210 and is currently estimated at $918,004, approximately $727 per square foot. 1240 E 34th St is a home located in Kings County with nearby schools including P.S. 193 Gil Hodges, Andries Hudde School, and Mesivta Tiferes Yisroel.
Ownership History
Date
Name
Owned For
Owner Type
Purchase Details
Closed on
May 16, 2017
Sold by
Ellenberg Shoshana
Bought by
Kenigsberg Max and Mantel Esther
Current Estimated Value
Home Financials for this Owner
Home Financials are based on the most recent Mortgage that was taken out on this home.
Original Mortgage
$543,200
Outstanding Balance
$451,738
Interest Rate
4.1%
Mortgage Type
Purchase Money Mortgage
Estimated Equity
$466,266
Purchase Details
Closed on
Sep 13, 1999
Sold by
Perlowitz Goldie
Bought by
Ellenberg Shoshana
Home Financials for this Owner
Home Financials are based on the most recent Mortgage that was taken out on this home.
Original Mortgage
$38,285
Interest Rate
7.71%
Purchase Details
Closed on
Mar 26, 1998
Sold by
Mutone Nancy
Bought by
Easy 2 Buy Realty Inc
Home Financials for this Owner
Home Financials are based on the most recent Mortgage that was taken out on this home.
Original Mortgage
$151,050
Interest Rate
7.08%
Create a Home Valuation Report for This Property
The Home Valuation Report is an in-depth analysis detailing your home's value as well as a comparison with similar homes in the area
Home Values in the Area
Average Home Value in this Area
Purchase History
| Date | Buyer | Sale Price | Title Company |
|---|---|---|---|
| Kenigsberg Max | $679,000 | -- | |
| Ellenberg Shoshana | -- | Chicago Title Insurance Co | |
| Easy 2 Buy Realty Inc | -- | Chicago Title Insurance Co |
Source: Public Records
Mortgage History
| Date | Status | Borrower | Loan Amount |
|---|---|---|---|
| Open | Kenigsberg Max | $543,200 | |
| Previous Owner | Ellenberg Shoshana | $38,285 | |
| Previous Owner | Easy 2 Buy Realty Inc | $151,050 |
Source: Public Records
Tax History
| Year | Tax Paid | Tax Assessment Tax Assessment Total Assessment is a certain percentage of the fair market value that is determined by local assessors to be the total taxable value of land and additions on the property. | Land | Improvement |
|---|---|---|---|---|
| 2025 | $6,735 | $45,600 | $9,480 | $36,120 |
| 2024 | $6,735 | $37,320 | $9,480 | $27,840 |
| 2023 | $6,461 | $35,580 | $9,480 | $26,100 |
| 2022 | $6,008 | $37,080 | $9,480 | $27,600 |
| 2021 | $6,200 | $34,500 | $9,480 | $25,020 |
| 2019 | $5,846 | $41,340 | $9,480 | $31,860 |
| 2018 | $5,404 | $26,512 | $7,016 | $19,496 |
| 2017 | $4,813 | $25,081 | $6,940 | $18,141 |
| 2016 | $4,598 | $24,552 | $7,949 | $16,603 |
| 2015 | $2,634 | $24,552 | $9,832 | $14,720 |
| 2014 | $2,634 | $23,288 | $9,326 | $13,962 |
Source: Public Records
Map
Nearby Homes
- 1203 E 34th St
- 3206 Avenue K
- 1992 New York Ave
- 3402 Avenue J
- 3412 Avenue J
- 1117 E 31st St
- 1327 E 34th St
- 2031 New York Ave
- 1746 Flatbush Ave
- 1742 Flatbush Ave
- 1202 E 38th St
- 1229 E 37th St
- 1127 E 36th St
- 1006 E 31st St
- 973 E 32nd St
- 2525 Nostrand Ave Unit 5S
- 2525 Nostrand Ave Unit 7E
- 2525 Nostrand Ave Unit 2R
- 961 E 32nd St
- 945 E 32nd St
- 1236 E 34th St
- 1242 E 34th St
- 1234 E 34th St
- 1244 E 34th St
- 1232 E 34th St
- 1248 E 34th St
- 1230 E 34th St
- 1250 E 34th St
- 1228 E 34th St
- 1252 E 34 St
- 1252 E 34th St
- 1937 New York Ave
- 1939 New York Ave
- 1933 New York Ave
- 1941 New York Ave
- 1931 New York Ave
- 1945 New York Ave
- 1929 New York Ave
- 1220 E 34th St Unit 1222
- 1220-1222 E 34th St
Your Personal Tour Guide
Ask me questions while you tour the home.