1240 NE Mcwilliams Rd Bremerton, WA 98311
Estimated Value: $466,000 - $510,000
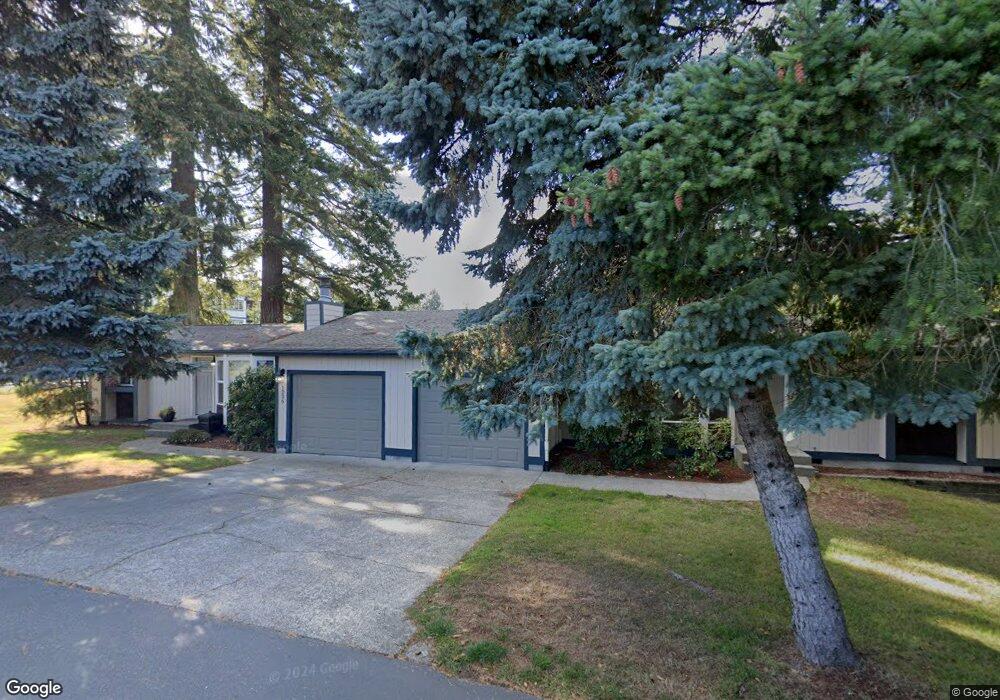
About This Home
This charming two-bedroom one bath home (duplex) with garage and rear covered deck has been updated throughout and is centrally located between Bremerton and Silverdale, close to shopping, dining, highway and bus access. Kitchen includes stove, refrigerator, dishwasher, and garbage disposal. This unit also includes an interior washer and dryer. Lawn is maintained regularly by the owner as part of the package. Small pets under 20 lbs may be considered with additional security deposit.
Open House on Monday, 14 Oct 2024, 2pm to 4pm. Please call to schedule other showing times.
Additional Information:
This is a Non-Smoking/Vaping unit. Water, Sewer, and Lawn Care are included; Tenant pays all other utilities. Background and credit screening is required. Minimum acceptable income is 3x rent. Maximum occupancy is two adults and two children. Two vehicle limit. Small pets permitted upon approval and additional pet security deposit ($500). First month's rent and security deposit due at signing. Tenant is required to maintain renters insurance.
Ownership History
Purchase Details
Home Values in the Area
Average Home Value in this Area
Purchase History
| Date | Buyer | Sale Price | Title Company |
|---|---|---|---|
| Jepsen Daniel M | -- | None Available |
Property History
| Date | Event | Price | List to Sale | Price per Sq Ft |
|---|---|---|---|---|
| 10/11/2024 10/11/24 | For Rent | $1,700 | -- | -- |
Tax History Compared to Growth
Tax History
| Year | Tax Paid | Tax Assessment Tax Assessment Total Assessment is a certain percentage of the fair market value that is determined by local assessors to be the total taxable value of land and additions on the property. | Land | Improvement |
|---|---|---|---|---|
| 2026 | $3,603 | $363,590 | $113,450 | $250,140 |
| 2025 | $3,603 | $363,590 | $113,450 | $250,140 |
| 2024 | $3,505 | $363,590 | $113,450 | $250,140 |
| 2023 | $3,513 | $363,590 | $113,450 | $250,140 |
| 2022 | $3,304 | $300,670 | $93,760 | $206,910 |
| 2021 | $2,758 | $236,430 | $69,410 | $167,020 |
| 2020 | $2,587 | $224,030 | $65,500 | $158,530 |
| 2019 | $6,229 | $202,110 | $59,150 | $142,960 |
| 2018 | $2,569 | $167,770 | $48,880 | $118,890 |
| 2017 | $2,286 | $167,770 | $48,880 | $118,890 |
| 2016 | $2,206 | $149,800 | $43,640 | $106,160 |
| 2015 | $2,297 | $163,930 | $48,340 | $115,590 |
| 2014 | $2,248 | $156,850 | $48,340 | $108,510 |
| 2013 | $2,296 | $156,850 | $48,340 | $108,510 |
Map
- 940 Yoder Ln NE
- 1858 NE Mcwilliams Rd
- 6522 State Hwy 303 NE
- 865 NE Rimrock Dr
- 0 NE Dawn Rd Unit NWM2413151
- 6398 Juanita Cir NE
- 960 NE Marwood Dr
- 2112 NE Lexington Dr
- 5600 Wisteria Ln NE
- 535 NE Saturn Ln
- 7020 Saint Charles Ln NE
- 9422 Fairhaven Cir NE
- 750 NE Woods Ct
- 425 NE Saturn Ln
- 404 NE Saturn Ln
- 749 NE Woods Ct
- 760 NE Woods Ct
- 6748 Scorpio Ln NE
- 7545 Old Military Rd NE
- 781 NE Woods Place
- 1256 NE Mcwilliams Rd
- 1224 NE Mcwilliams Rd
- 1272 NE Mcwilliams Rd
- 1180 NE Mcwilliams Rd
- 6468 Graceland Ave NE
- 6490 Graceland Rd NE
- 6522 Graceland Ave NE
- 1350 NE Mcwilliams Rd
- 1365 NE Mcwilliams Rd
- 1354 NE Mcwilliams Rd
- 1140 NE Mcwilliams Rd
- 1211 NE Mcwilliams Rd
- 1215 NE Mcwilliams Rd
- 6451 Graceland Ave NE
- 6481 Graceland Ave NE
- 1079 NE Mcwilliams Rd
- 1358 NE Mcwilliams Rd
- 1201 NE Mcwilliams Rd
- 6571 Graceland Ave NE
- 1273 NE Mcwilliams Rd