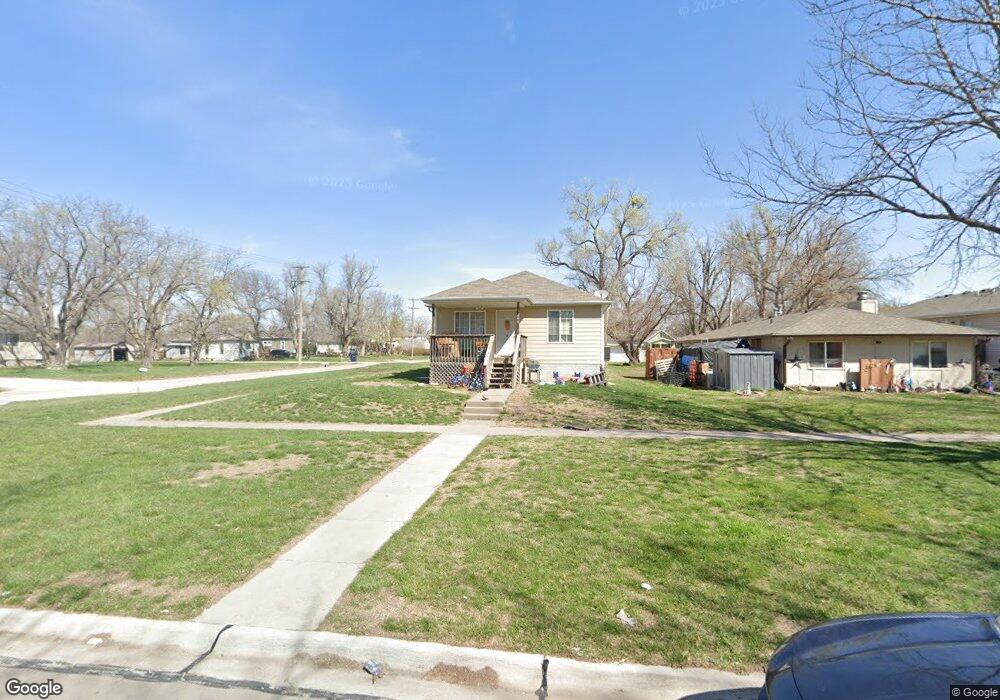
1240 S 1st St Lincoln, NE 68502
South Salt Creek NeighborhoodEstimated Value: $212,000 - $249,000
3
Beds
1
Bath
1,800
Sq Ft
$128/Sq Ft
Est. Value
About This Home
This home is located at 1240 S 1st St, Lincoln, NE 68502 and is currently estimated at $230,149, approximately $127 per square foot. 1240 S 1st St is a home located in Lancaster County with nearby schools including Everett Elementary School, Park Middle School, and Lincoln High School.
Ownership History
Date
Name
Owned For
Owner Type
Purchase Details
Closed on
Nov 1, 2013
Sold by
Becker Jayson and Becker Nicki
Bought by
Bt Holdings Llc
Current Estimated Value
Home Financials for this Owner
Home Financials are based on the most recent Mortgage that was taken out on this home.
Original Mortgage
$100,000
Outstanding Balance
$74,761
Interest Rate
4.37%
Mortgage Type
Future Advance Clause Open End Mortgage
Estimated Equity
$155,388
Purchase Details
Closed on
Oct 10, 2007
Sold by
Wendall Ray Investments Llc
Bought by
Becker Jayson and Fortney Martin
Purchase Details
Closed on
Dec 29, 2006
Sold by
Nelson Property Management Llc
Bought by
Wendell Ray Investments Llc
Home Financials for this Owner
Home Financials are based on the most recent Mortgage that was taken out on this home.
Original Mortgage
$28,000
Interest Rate
6.2%
Mortgage Type
Unknown
Create a Home Valuation Report for This Property
The Home Valuation Report is an in-depth analysis detailing your home's value as well as a comparison with similar homes in the area
Home Values in the Area
Average Home Value in this Area
Purchase History
| Date | Buyer | Sale Price | Title Company |
|---|---|---|---|
| Bt Holdings Llc | $110,000 | Charter Title & Escrow Servi | |
| Becker Jayson | -- | None Available | |
| Wendell Ray Investments Llc | $28,000 | Ntc |
Source: Public Records
Mortgage History
| Date | Status | Borrower | Loan Amount |
|---|---|---|---|
| Open | Bt Holdings Llc | $100,000 | |
| Previous Owner | Wendell Ray Investments Llc | $28,000 |
Source: Public Records
Tax History Compared to Growth
Tax History
| Year | Tax Paid | Tax Assessment Tax Assessment Total Assessment is a certain percentage of the fair market value that is determined by local assessors to be the total taxable value of land and additions on the property. | Land | Improvement |
|---|---|---|---|---|
| 2025 | $2,576 | $207,000 | $38,300 | $168,700 |
| 2024 | $2,576 | $186,400 | $38,300 | $148,100 |
| 2023 | $3,124 | $186,400 | $38,300 | $148,100 |
| 2022 | $3,476 | $174,400 | $19,100 | $155,300 |
| 2021 | $3,288 | $174,400 | $19,100 | $155,300 |
| 2020 | $2,432 | $127,300 | $19,100 | $108,200 |
| 2019 | $2,221 | $116,200 | $19,100 | $97,100 |
| 2018 | $2,230 | $116,200 | $19,100 | $97,100 |
| 2017 | $2,040 | $105,300 | $19,100 | $86,200 |
| 2016 | $2,050 | $105,300 | $19,100 | $86,200 |
| 2015 | $2,036 | $105,300 | $19,100 | $86,200 |
| 2014 | -- | $110,100 | $19,100 | $91,000 |
| 2013 | -- | $110,100 | $19,100 | $91,000 |
Source: Public Records
Map
Nearby Homes