Estimated Value: $298,000 - $323,000
--
Bed
3
Baths
1,897
Sq Ft
$163/Sq Ft
Est. Value
About This Home
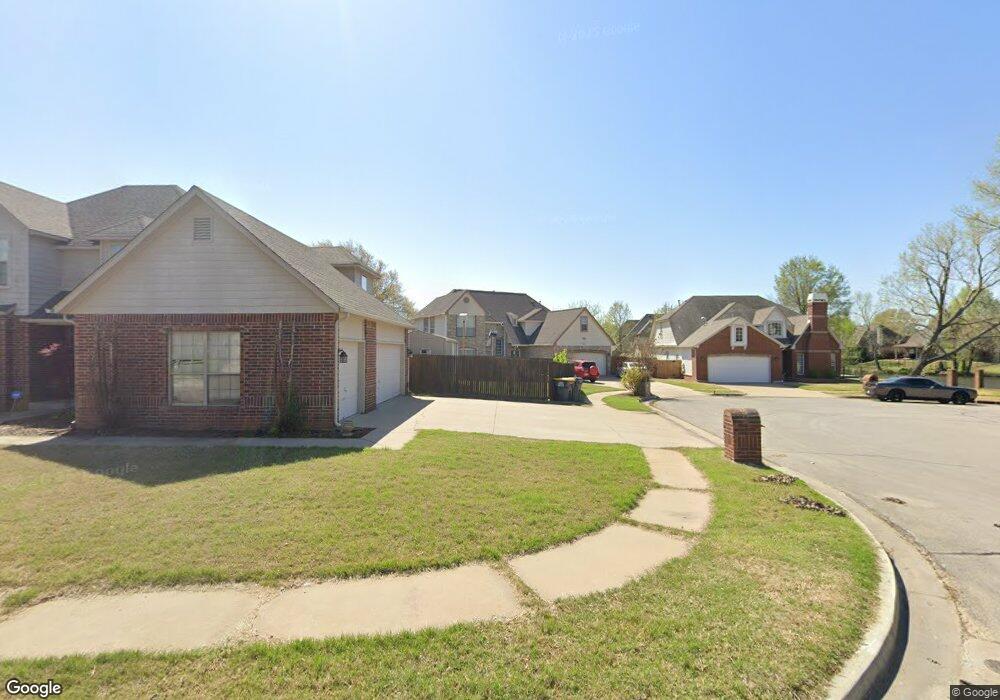
This home is located at 1240 W 113th St S, Jenks, OK 74037 and is currently estimated at $309,425, approximately $163 per square foot. 1240 W 113th St S is a home located in Tulsa County with nearby schools including Jenks West Elementary School, Jenks West Intermediate Elementary School, and Jenks Middle School.
Ownership History
Date
Name
Owned For
Owner Type
Purchase Details
Closed on
Feb 3, 2017
Sold by
Chatzigiannidis Gorges and Chatzigiannidis Efstathia
Bought by
Chatzigiannidis George and Chatzigiannidis Efstathia
Current Estimated Value
Purchase Details
Closed on
Oct 30, 1998
Sold by
Masterplace Homes Inc
Bought by
Chatzigiannidis Gorges
Home Financials for this Owner
Home Financials are based on the most recent Mortgage that was taken out on this home.
Original Mortgage
$126,000
Outstanding Balance
$27,189
Interest Rate
6.46%
Mortgage Type
Purchase Money Mortgage
Estimated Equity
$282,236
Purchase Details
Closed on
Jul 10, 1998
Sold by
Wingard Oral D and Wingard Judy K
Bought by
Masterpiece Homes Inc
Home Financials for this Owner
Home Financials are based on the most recent Mortgage that was taken out on this home.
Original Mortgage
$121,135
Interest Rate
7.09%
Mortgage Type
Construction
Purchase Details
Closed on
Jul 1, 1996
Create a Home Valuation Report for This Property
The Home Valuation Report is an in-depth analysis detailing your home's value as well as a comparison with similar homes in the area
Home Values in the Area
Average Home Value in this Area
Purchase History
| Date | Buyer | Sale Price | Title Company |
|---|---|---|---|
| Chatzigiannidis George | -- | None Available | |
| Chatzigiannidis Gorges | $140,000 | -- | |
| Masterpiece Homes Inc | $28,000 | -- | |
| -- | $24,000 | -- |
Source: Public Records
Mortgage History
| Date | Status | Borrower | Loan Amount |
|---|---|---|---|
| Open | Chatzigiannidis Gorges | $126,000 | |
| Previous Owner | Masterpiece Homes Inc | $121,135 |
Source: Public Records
Tax History Compared to Growth
Tax History
| Year | Tax Paid | Tax Assessment Tax Assessment Total Assessment is a certain percentage of the fair market value that is determined by local assessors to be the total taxable value of land and additions on the property. | Land | Improvement |
|---|---|---|---|---|
| 2024 | $2,412 | $19,547 | $2,762 | $16,785 |
| 2023 | $2,412 | $19,948 | $3,032 | $16,916 |
| 2022 | $2,361 | $18,367 | $3,825 | $14,542 |
| 2021 | $2,318 | $17,803 | $3,708 | $14,095 |
| 2020 | $2,198 | $17,256 | $3,594 | $13,662 |
| 2019 | $2,213 | $17,256 | $3,594 | $13,662 |
| 2018 | $2,228 | $17,256 | $3,594 | $13,662 |
| 2017 | $2,191 | $18,256 | $3,802 | $14,454 |
| 2016 | $2,245 | $18,256 | $3,802 | $14,454 |
| 2015 | $2,267 | $18,256 | $3,802 | $14,454 |
| 2014 | $2,247 | $18,256 | $3,802 | $14,454 |
Source: Public Records
Map
Nearby Homes
- 110 W 113th St S
- 11515 S Mulberry Ct
- 1623 W 114th St
- 11527 S Nandina Place
- 1615 W 115th Place
- 12004 S Nandina Ave
- 11260 S Fir Ave
- 1226 W 109th Place S
- 11264 S Fir Ave
- 11312 S Fir Ave
- 11308 S Fir Ave
- 10906 S Mulberry Ave
- 11224 S Fir Ave
- 11265 S Fir Ave
- 11261 S Fir Ave
- 691 W 113th Ct S
- 682 W 113th Ct S
- 10821 S Fir St
- 1116 W 108th Place S
- 11206 S Redbud St
- 1244 W 113th St S
- 11316 S Locust Ave
- 1236 W 113th St S
- 11318 S Locust Ave
- 1241 W 114th Ct S
- 11314 S Locust Ave
- 1245 W 114th Ct S
- 1237 W 114th Ct S
- 11310 S Locust Ave
- 1302 W 113th St S
- 1232 W 113th St S
- 1231 W 114th Ct S
- 1241 W 113th St S
- 1310 W 113th St S
- 1245 W 113th St S
- 1237 W 113th St S
- 1232 W 114th Ct S
- 11317 S Locust Ave
- 1301 W 113th St S
- 11315 S Locust Ave