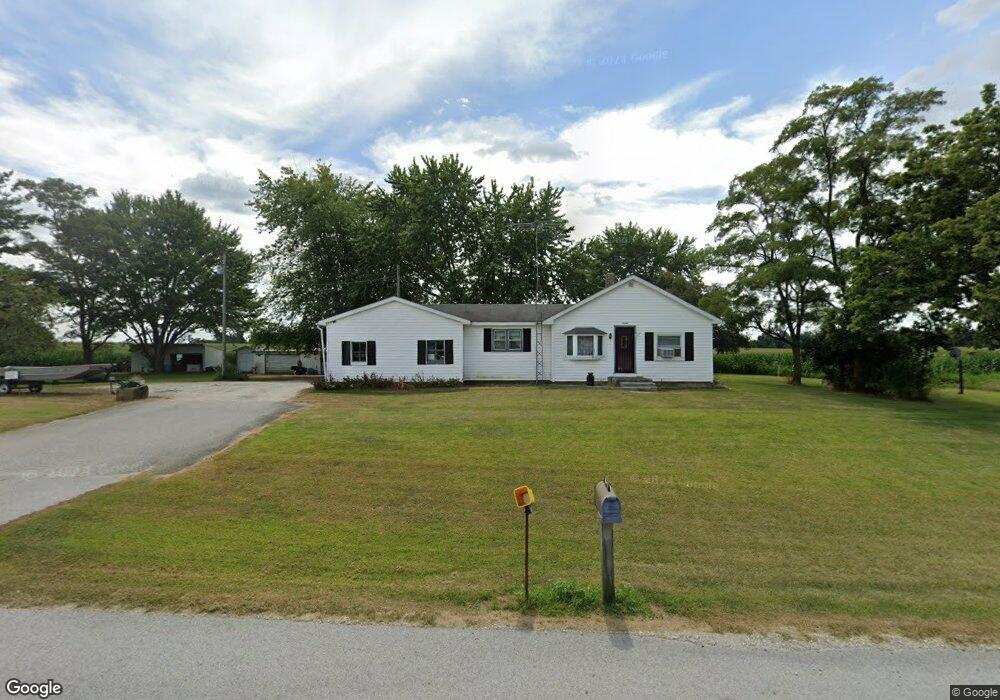
12408 W State Road 18 Delphi, IN 46923
Estimated Value: $203,000 - $314,000
3
Beds
1
Bath
1,144
Sq Ft
$215/Sq Ft
Est. Value
About This Home
This home is located at 12408 W State Road 18, Delphi, IN 46923 and is currently estimated at $246,261, approximately $215 per square foot. 12408 W State Road 18 is a home located in Carroll County with nearby schools including Delphi Community Elementary School, Delphi Community Middle School, and Delphi Community High School.
Ownership History
Date
Name
Owned For
Owner Type
Purchase Details
Closed on
Jan 31, 2024
Sold by
Clawson Douglas E
Bought by
Clawson Gregory A and Clawson Bryon L
Current Estimated Value
Purchase Details
Closed on
Oct 2, 2019
Sold by
Clawson Douglas E
Bought by
Clawson Greg and Clawson Bryon L
Purchase Details
Closed on
Feb 8, 2019
Sold by
Clawson Gene E
Bought by
Clawson Shirley and Clawson Gregory A
Purchase Details
Closed on
Sep 4, 2018
Sold by
Secreatry Of Veterans Affairs
Bought by
Cole Jacob
Home Financials for this Owner
Home Financials are based on the most recent Mortgage that was taken out on this home.
Original Mortgage
$112,000
Interest Rate
4.5%
Mortgage Type
New Conventional
Purchase Details
Closed on
Sep 2, 2014
Sold by
Clawson Gene E and Clawson Shirley
Bought by
Clawson Greg A and Clawson Bryon L
Create a Home Valuation Report for This Property
The Home Valuation Report is an in-depth analysis detailing your home's value as well as a comparison with similar homes in the area
Home Values in the Area
Average Home Value in this Area
Purchase History
| Date | Buyer | Sale Price | Title Company |
|---|---|---|---|
| Clawson Gregory A | $15,951 | None Listed On Document | |
| Clawson Greg | -- | None Available | |
| Clawson Shirley | -- | None Available | |
| Cole Jacob | -- | Capital Title | |
| Clawson Greg A | -- | None Available |
Source: Public Records
Mortgage History
| Date | Status | Borrower | Loan Amount |
|---|---|---|---|
| Previous Owner | Cole Jacob | $112,000 |
Source: Public Records
Tax History Compared to Growth
Tax History
| Year | Tax Paid | Tax Assessment Tax Assessment Total Assessment is a certain percentage of the fair market value that is determined by local assessors to be the total taxable value of land and additions on the property. | Land | Improvement |
|---|---|---|---|---|
| 2024 | $823 | $159,100 | $35,500 | $123,600 |
| 2023 | $566 | $124,600 | $35,500 | $89,100 |
| 2022 | $566 | $115,200 | $35,500 | $79,700 |
| 2021 | $514 | $106,000 | $35,500 | $70,500 |
| 2020 | $525 | $102,300 | $31,600 | $70,700 |
| 2019 | $355 | $95,300 | $31,600 | $63,700 |
| 2018 | $318 | $93,500 | $31,600 | $61,900 |
| 2017 | $297 | $93,000 | $31,600 | $61,400 |
| 2016 | $307 | $92,400 | $26,600 | $65,800 |
| 2014 | $262 | $77,900 | $22,000 | $55,900 |
| 2013 | $262 | $77,700 | $22,500 | $55,200 |
Source: Public Records
Map
Nearby Homes
- 11503 W Tecumseh Bend Rd
- 10360 S Wildwood Ct
- 2801 N 930 W Unit 10
- 9331 W 310 N
- Lot 1 S 300 E
- 6369 N 1225 West Crossroad
- 2075 N 925 W
- 4139 N 900 W
- 1579 W Herring Way
- 1158 N Brewer Ave
- Lot 4 E 850 S
- Lot 6 E 850 S
- Lot 3 E 850 S
- Lot 5 E 850 S
- Lot 2 E 850 S
- Lot 10 E 850 S
- 9120 Herring Ln
- 9170 Herring Ln
- 317 N Market St
- 215 W Front St
- 12606 W State Road 18
- 3590 N 1215 W
- 12057 W State Road 18
- 12252 W State Road 18
- 3485 N 1215 W
- 12611 W State Road 18
- 2985 N 1275 W
- 2967 N 1275 W
- 11893 W State Road 18
- 11259 W Tecumseh Bend Rd
- 11261 W Tecumseh Bend Rd
- 2931 N 1275 W
- 11263 W Tecumseh Bend Rd
- 2895 N 1275 W
- 2863 N 1275 W
- 11281 W Tecumseh Bend Rd
- 2835 N 1275 W
- 11295 W Tecumseh Bend Rd
- 11269 W Tecumseh Bend Rd
- 11289 W Tecumseh Bend Rd