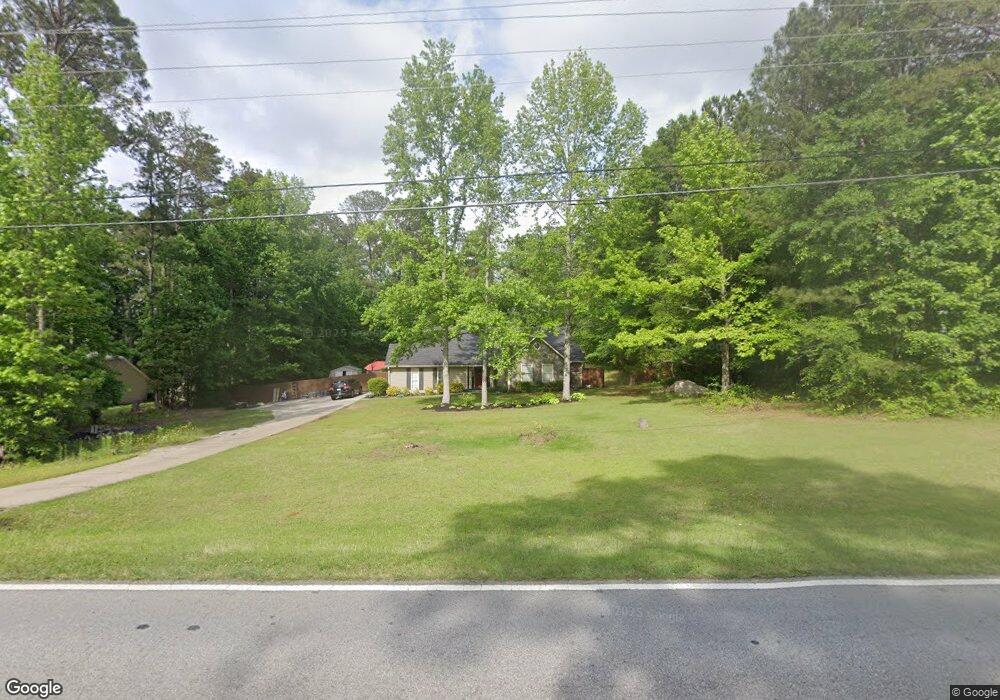
1241 Fisher Rd NE Sharpsburg, GA 30277
Estimated Value: $385,035 - $453,000
4
Beds
2
Baths
2,124
Sq Ft
$199/Sq Ft
Est. Value
About This Home
This home is located at 1241 Fisher Rd NE, Sharpsburg, GA 30277 and is currently estimated at $422,509, approximately $198 per square foot. 1241 Fisher Rd NE is a home located in Coweta County with nearby schools including Thomas Crossroads Elementary School, Lee Middle School, and Northgate High School.
Ownership History
Date
Name
Owned For
Owner Type
Purchase Details
Closed on
May 23, 2014
Sold by
Smcc Homes 1 Llc
Bought by
Colletta Michael J and Colletta Sara N
Current Estimated Value
Home Financials for this Owner
Home Financials are based on the most recent Mortgage that was taken out on this home.
Original Mortgage
$175,275
Outstanding Balance
$133,542
Interest Rate
4.4%
Mortgage Type
New Conventional
Estimated Equity
$288,967
Purchase Details
Closed on
Oct 17, 2013
Sold by
Eh Pooled Investments Lp
Bought by
Smcc Homes 1 Llc
Purchase Details
Closed on
Apr 25, 2013
Sold by
Secretary Of Housing And U
Bought by
Eh Pooled Investments Lp
Purchase Details
Closed on
Dec 6, 2012
Sold by
Midfirst Bank
Bought by
Secretary Of Housing And Urban and C/O Us Dept Of Hud Etal
Purchase Details
Closed on
Nov 13, 2012
Sold by
Stigall Wanda S
Bought by
Midfirst Banl
Purchase Details
Closed on
Jul 17, 2008
Sold by
Stigall Wanda S
Bought by
Stigall Wanda S and Stigall Jessica
Home Financials for this Owner
Home Financials are based on the most recent Mortgage that was taken out on this home.
Original Mortgage
$164,836
Interest Rate
6.27%
Mortgage Type
FHA
Purchase Details
Closed on
Jun 29, 2007
Sold by
Fannie Mae
Bought by
Stigall Wanda S
Home Financials for this Owner
Home Financials are based on the most recent Mortgage that was taken out on this home.
Original Mortgage
$128,963
Interest Rate
6.52%
Mortgage Type
New Conventional
Purchase Details
Closed on
Oct 7, 2006
Sold by
Cook Scot A
Bought by
Indymac Bank Fsb
Purchase Details
Closed on
Oct 3, 2006
Sold by
Incymac Bank Fsb
Bought by
Federal National Mortgage Association
Purchase Details
Closed on
Mar 18, 1998
Sold by
Clark Terry M
Bought by
Clark Properties & Invest
Purchase Details
Closed on
Feb 26, 1998
Sold by
Hutchings Gerald E and Hutchings Marian E
Bought by
Clark Terry M
Purchase Details
Closed on
Mar 1, 1990
Bought by
Hutchings Gerald E
Purchase Details
Closed on
Nov 30, 1988
Bought by
Rush Charles E and Rush Shi
Create a Home Valuation Report for This Property
The Home Valuation Report is an in-depth analysis detailing your home's value as well as a comparison with similar homes in the area
Home Values in the Area
Average Home Value in this Area
Purchase History
| Date | Buyer | Sale Price | Title Company |
|---|---|---|---|
| Colletta Michael J | $184,500 | -- | |
| Colletta Michael J | $184,500 | -- | |
| Smcc Homes 1 Llc | $75,000 | -- | |
| Smcc Homes 1 Llc | $75,000 | -- | |
| Eh Pooled Investments Lp | $66,000 | -- | |
| Eh Pooled Investments Lp | $66,000 | -- | |
| Secretary Of Housing And Urban | $164,836 | -- | |
| Secretary Of Housing And Urban | $164,836 | -- | |
| Midfirst Banl | $164,836 | -- | |
| Midfirst Banl | $164,836 | -- | |
| Stigall Wanda S | -- | -- | |
| Stigall Wanda S | -- | -- | |
| Stigall Wanda S | -- | -- | |
| Stigall Wanda S | -- | -- | |
| Indymac Bank Fsb | $158,818 | -- | |
| Indymac Bank Fsb | $158,818 | -- | |
| Federal National Mortgage Association | -- | -- | |
| Federal National Mortgage Association | -- | -- | |
| Clark Properties & Invest | $100,000 | -- | |
| Clark Properties & Invest | $100,000 | -- | |
| Clark Terry M | $104,500 | -- | |
| Clark Terry M | $104,500 | -- | |
| Hutchings Gerald E | $94,500 | -- | |
| Hutchings Gerald E | $94,500 | -- | |
| Rush Charles E | $80,800 | -- | |
| Rush Charles E | $80,800 | -- |
Source: Public Records
Mortgage History
| Date | Status | Borrower | Loan Amount |
|---|---|---|---|
| Open | Colletta Michael J | $175,275 | |
| Previous Owner | Stigall Wanda S | $164,836 | |
| Previous Owner | Stigall Wanda S | $128,963 |
Source: Public Records
Tax History Compared to Growth
Tax History
| Year | Tax Paid | Tax Assessment Tax Assessment Total Assessment is a certain percentage of the fair market value that is determined by local assessors to be the total taxable value of land and additions on the property. | Land | Improvement |
|---|---|---|---|---|
| 2025 | $3,300 | $139,692 | $26,000 | $113,692 |
| 2024 | $3,356 | $144,579 | $26,000 | $118,579 |
| 2023 | $3,356 | $121,230 | $22,000 | $99,230 |
| 2022 | $2,842 | $115,358 | $22,000 | $93,358 |
| 2021 | $2,437 | $92,553 | $18,000 | $74,553 |
| 2020 | $2,338 | $103,802 | $18,000 | $85,802 |
| 2019 | $2,373 | $81,086 | $10,000 | $71,086 |
| 2018 | $2,377 | $81,086 | $10,000 | $71,086 |
| 2017 | $2,377 | $81,086 | $10,000 | $71,086 |
| 2016 | $2,136 | $73,748 | $10,000 | $63,748 |
| 2015 | $1,988 | $69,834 | $10,000 | $59,834 |
| 2014 | $1,604 | $48,164 | $10,000 | $38,164 |
Source: Public Records
Map
Nearby Homes
- 10 Queens Ct
- 395 Beaumont Farms Dr
- 374 Beaumont Farms Dr
- 195 Mapledale Trail Unit 4
- 115 Platinum Ridge
- 430 Mapledale Trail
- 185 Mapledale Trail
- 75 Kripple Kreek Dr
- 75 Tomahawk Dr
- 757 Fischer Rd
- 435 Mapledale Trail
- 190 Willow Lake Ln
- 164 Westberry St
- 156 Westberry St
- 144 Westberry St
- 916 Gambino Trace
- 0 Maple Trail
- 10 Fisher Way
- 135 Willow Lake Ln
- 136 Barrington Grange Dr
- 1241 Fischer Rd
- 1255 Fischer Rd
- 1255 Fischer Rd Unit 3
- 1233 Fischer Rd
- 280 Little Creek Dr
- 1269 Fischer Rd
- 290 Little Creek Dr
- 1217 Fischer Rd
- 10 Indian Creek Trail
- 1238 Fischer Rd
- 260 Little Creek Dr
- 300 Little Creek Dr
- 21 Beaumont Farms Dr
- 1283 Fischer Rd
- 5 Indian Creek Trail
- 1195 Fischer Rd
- 310 Little Creek Dr
- 16 Beaumont Farms Dr
- 265 Little Creek Dr
- 250 Little Creek Dr