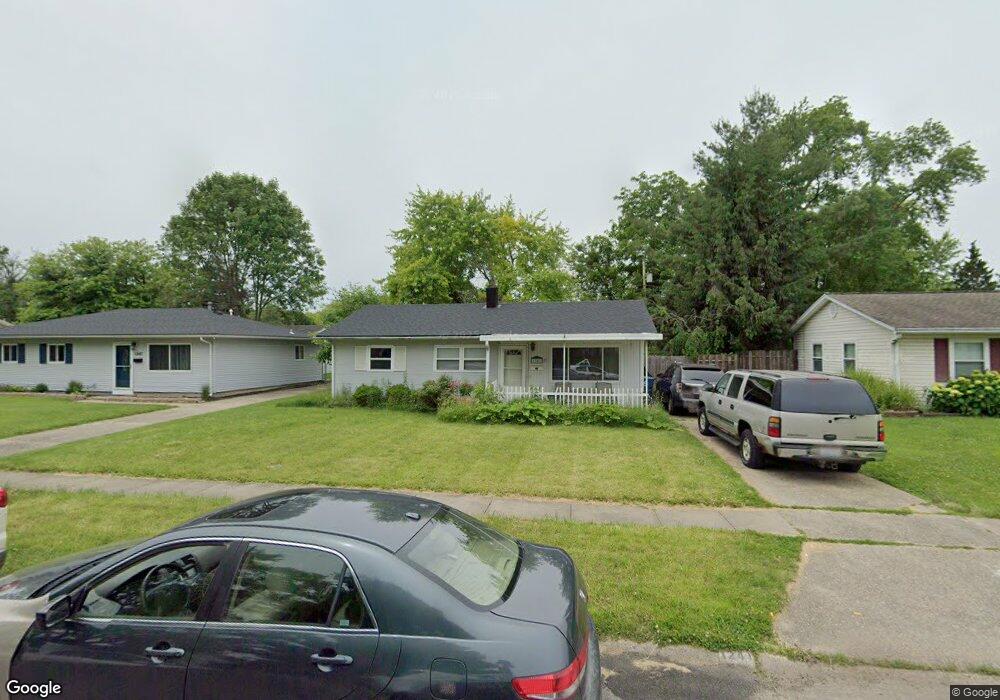
1241 Jeanette Dr Dayton, OH 45432
Estimated Value: $147,000 - $168,000
3
Beds
1
Bath
925
Sq Ft
$167/Sq Ft
Est. Value
About This Home
This home is located at 1241 Jeanette Dr, Dayton, OH 45432 and is currently estimated at $154,765, approximately $167 per square foot. 1241 Jeanette Dr is a home located in Montgomery County with nearby schools including Parkwood Elementary School, Herman K Ankeney Middle School, and Beavercreek High School.
Ownership History
Date
Name
Owned For
Owner Type
Purchase Details
Closed on
Mar 8, 2012
Sold by
Dkr Mortgage Asset Trust Ii
Bought by
T Michael Properties Llc
Current Estimated Value
Purchase Details
Closed on
Mar 25, 2005
Sold by
Tills Investment Co Llc
Bought by
Shade Michael A and Shade Jessica M
Home Financials for this Owner
Home Financials are based on the most recent Mortgage that was taken out on this home.
Original Mortgage
$86,541
Interest Rate
5.64%
Mortgage Type
FHA
Purchase Details
Closed on
Sep 24, 2004
Sold by
Tills Arthur D and Tills Jill A
Bought by
Tills Investment Co Llc
Purchase Details
Closed on
Jul 3, 2001
Sold by
Halliwell Mark J and Halliwell Teresa L
Bought by
Tills Arthur D and Tills Jill A
Home Financials for this Owner
Home Financials are based on the most recent Mortgage that was taken out on this home.
Original Mortgage
$55,000
Interest Rate
7.27%
Create a Home Valuation Report for This Property
The Home Valuation Report is an in-depth analysis detailing your home's value as well as a comparison with similar homes in the area
Home Values in the Area
Average Home Value in this Area
Purchase History
| Date | Buyer | Sale Price | Title Company |
|---|---|---|---|
| T Michael Properties Llc | $45,000 | Me Chicago Title | |
| Shade Michael A | $87,900 | Republic Title Agency Inc | |
| Tills Investment Co Llc | -- | None Available | |
| Tills Arthur D | $70,100 | -- |
Source: Public Records
Mortgage History
| Date | Status | Borrower | Loan Amount |
|---|---|---|---|
| Previous Owner | Shade Michael A | $86,541 | |
| Previous Owner | Tills Arthur D | $55,000 |
Source: Public Records
Tax History Compared to Growth
Tax History
| Year | Tax Paid | Tax Assessment Tax Assessment Total Assessment is a certain percentage of the fair market value that is determined by local assessors to be the total taxable value of land and additions on the property. | Land | Improvement |
|---|---|---|---|---|
| 2024 | $2,114 | $34,540 | $9,640 | $24,900 |
| 2023 | $2,114 | $34,540 | $9,640 | $24,900 |
| 2022 | $1,620 | $22,570 | $6,300 | $16,270 |
| 2021 | $1,627 | $22,570 | $6,300 | $16,270 |
| 2020 | $1,632 | $22,570 | $6,300 | $16,270 |
| 2019 | $1,795 | $22,650 | $6,300 | $16,350 |
| 2018 | $1,670 | $22,650 | $6,300 | $16,350 |
| 2017 | $1,640 | $22,650 | $6,300 | $16,350 |
| 2016 | $1,629 | $21,580 | $6,300 | $15,280 |
| 2015 | $1,785 | $21,580 | $6,300 | $15,280 |
| 2014 | $1,785 | $21,580 | $6,300 | $15,280 |
| 2012 | -- | $24,190 | $7,000 | $17,190 |
Source: Public Records
Map
Nearby Homes
- 5926 Penn Ave
- 1195 Ringwalt Dr
- 4475 Ardonna Ln
- 5778 Sharp Rd
- 5664 Mayville Dr
- 5588 Sharp Rd
- 1951 Scotch Pine Dr
- 1653 Stedman Ln
- 884 Crestmont Dr
- 5619 Candlelight Ln
- Lot 10 Linden Ave
- Lot 11 Linden Ave
- 1307 Cobblestone St
- 1355 Cobblestone St
- 1890 Stedman Ln
- 4174 Mapleview Dr
- 5522 Woodbine Ave
- 4328 Richland Ave
- 5349 Pickford Dr
- 4311 Richland Ave
- 1247 Jeanette Dr
- 1235 Jeanette Dr
- 1253 Jeanette Dr
- 1229 Jeanette Dr
- 1242 Reedsdale Rd
- 1236 Reedsdale Rd
- 1248 Reedsdale Rd
- 1242 Jeanette Dr
- 1236 Jeanette Dr
- 1259 Jeanette Dr
- 1230 Reedsdale Rd
- 1223 Jeanette Dr
- 1248 Jeanette Dr
- 1230 Jeanette Dr
- 1254 Jeanette Dr
- 1224 Reedsdale Rd
- 1224 Jeanette Dr
- 1217 Jeanette Dr
- 1260 Jeanette Dr
- 1260 Reedsdale Rd