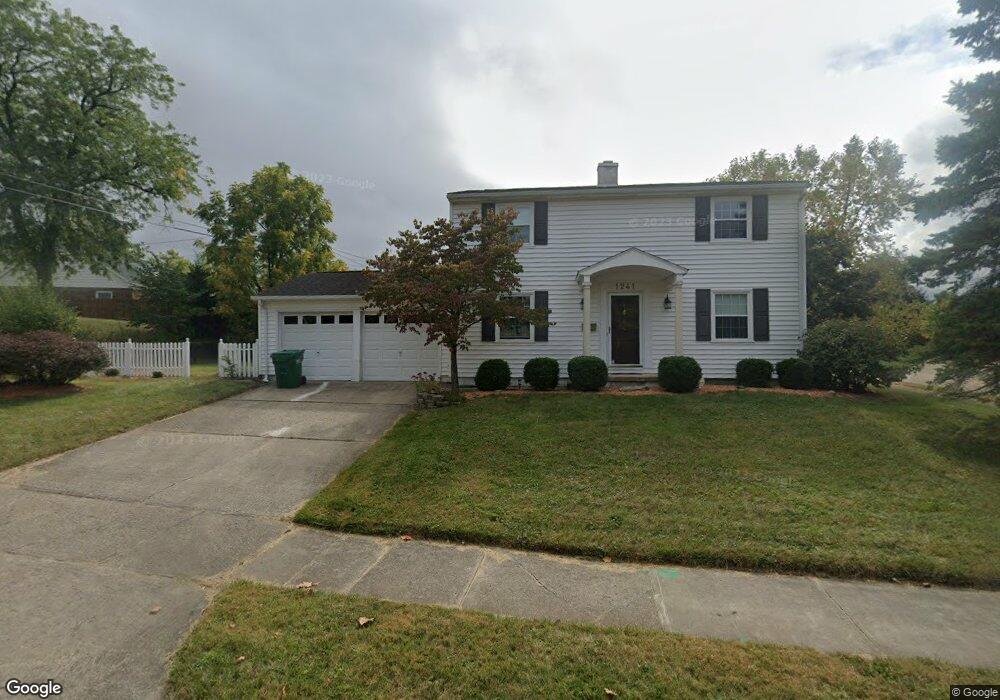
1241 Redbud Ln Springfield, OH 45504
Estimated Value: $206,790 - $229,000
3
Beds
3
Baths
1,850
Sq Ft
$118/Sq Ft
Est. Value
About This Home
This home is located at 1241 Redbud Ln, Springfield, OH 45504 and is currently estimated at $217,948, approximately $117 per square foot. 1241 Redbud Ln is a home located in Clark County with nearby schools including Snowhill Elementary School, Roosevelt Middle School, and Springfield High School.
Ownership History
Date
Name
Owned For
Owner Type
Purchase Details
Closed on
Aug 15, 2024
Sold by
Stephens Scott B and Stephens Maria T
Bought by
Fries Nathaniel E and Mccall Kaleb W
Current Estimated Value
Home Financials for this Owner
Home Financials are based on the most recent Mortgage that was taken out on this home.
Original Mortgage
$140,000
Outstanding Balance
$137,912
Interest Rate
6.89%
Mortgage Type
New Conventional
Estimated Equity
$80,036
Purchase Details
Closed on
Aug 14, 1995
Sold by
Marcum David P
Bought by
Stephens Scott B and Stephens Maria
Home Financials for this Owner
Home Financials are based on the most recent Mortgage that was taken out on this home.
Original Mortgage
$87,500
Interest Rate
7.51%
Mortgage Type
New Conventional
Purchase Details
Closed on
Oct 8, 1987
Create a Home Valuation Report for This Property
The Home Valuation Report is an in-depth analysis detailing your home's value as well as a comparison with similar homes in the area
Home Values in the Area
Average Home Value in this Area
Purchase History
| Date | Buyer | Sale Price | Title Company |
|---|---|---|---|
| Fries Nathaniel E | $175,000 | Sterling Land Title | |
| Fries Nathaniel E | $175,000 | Sterling Land Title | |
| Stephens Scott B | $97,500 | -- | |
| -- | $69,000 | -- |
Source: Public Records
Mortgage History
| Date | Status | Borrower | Loan Amount |
|---|---|---|---|
| Open | Fries Nathaniel E | $140,000 | |
| Closed | Fries Nathaniel E | $140,000 | |
| Previous Owner | Stephens Scott B | $87,500 |
Source: Public Records
Tax History
| Year | Tax Paid | Tax Assessment Tax Assessment Total Assessment is a certain percentage of the fair market value that is determined by local assessors to be the total taxable value of land and additions on the property. | Land | Improvement |
|---|---|---|---|---|
| 2025 | $1,944 | $57,330 | $9,330 | $48,000 |
| 2024 | $1,893 | $39,280 | $7,600 | $31,680 |
| 2023 | $1,893 | $39,280 | $7,600 | $31,680 |
| 2022 | $1,802 | $39,280 | $7,600 | $31,680 |
| 2021 | $1,802 | $33,710 | $6,000 | $27,710 |
| 2020 | $1,807 | $33,710 | $6,000 | $27,710 |
| 2019 | $1,811 | $33,710 | $6,000 | $27,710 |
| 2018 | $2,083 | $37,250 | $4,850 | $32,400 |
| 2017 | $2,082 | $39,050 | $4,851 | $34,199 |
| 2016 | $2,085 | $39,050 | $4,851 | $34,199 |
| 2015 | $1,657 | $35,130 | $4,851 | $30,279 |
| 2014 | $1,650 | $35,130 | $4,851 | $30,279 |
| 2013 | $1,632 | $35,130 | $4,851 | $30,279 |
Source: Public Records
Map
Nearby Homes
- 1329 Lamar Dr
- 720 W Harding Rd
- 1425 Sheaff Rd
- 820 W 1st St
- 648 N Tanglewood Dr
- 1015 Hillcrest Ave
- 408 Southwood Dr
- 327 Ardmore Rd
- 271 S Broadmoor Blvd
- 125 Hawthorne Rd
- 110 S Broadmoor Blvd
- 366 N Isabella St
- 423 N Jackson St Unit 425
- 430 N Jackson St
- 511 N Light St
- 424 N Shaffer St
- 424-424 1/2 N Shaffer St
- 705 Grant St Unit 705
- 705-705 1/2 Grant St Unit 705
- 306 N Western Ave
- 1720 Brookhollow Dr
- 1727 Briarwood Terrace
- 1715 Briarwood Terrace
- 1714 Brookhollow Dr
- 1744 Brookhollow Dr
- 1234 Redbud Ln
- 1733 Brookhollow Dr
- 1709 Briarwood Terrace
- 1727 Brookhollow Dr
- 1739 Brookhollow Dr
- 1228 Redbud Ln
- 1708 Brookhollow Dr
- 1721 Brookhollow Dr
- 1747 Brookhollow Dr
- 1215 Redbud Ln
- 1703 Briarwood Terrace
- 1222 Redbud Ln
- 1714 Briarwood Terrace
- 1709 Brookhollow Dr
- 1216 Redbud Ln
Your Personal Tour Guide
Ask me questions while you tour the home.