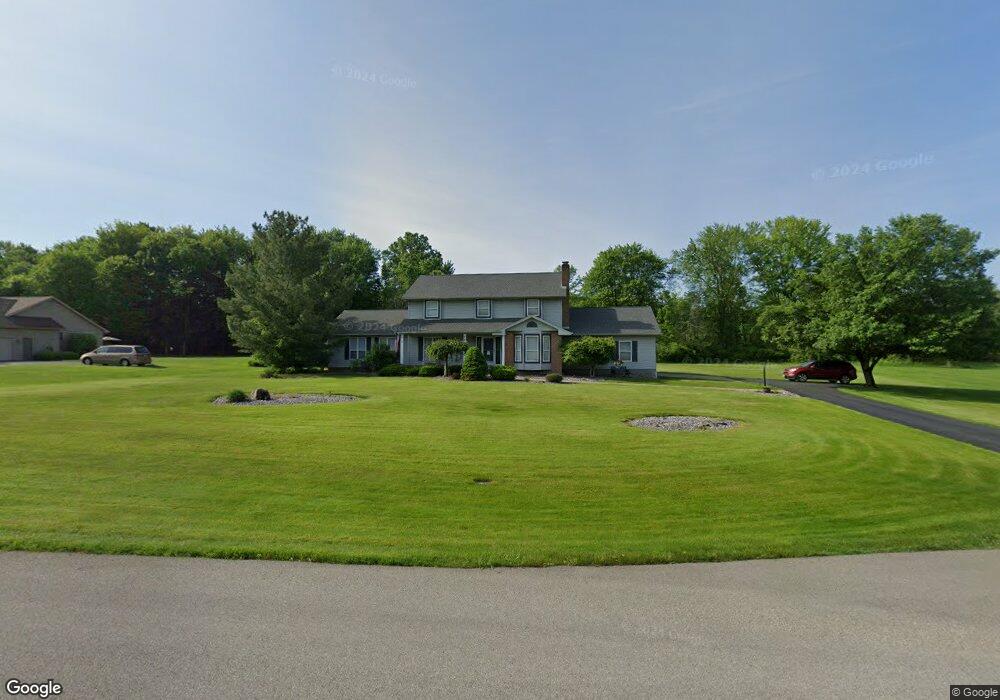
1241 Sharrott Run Place North Lima, OH 44452
Estimated Value: $463,000 - $514,000
4
Beds
3
Baths
2,833
Sq Ft
$175/Sq Ft
Est. Value
About This Home
This home is located at 1241 Sharrott Run Place, North Lima, OH 44452 and is currently estimated at $495,638, approximately $174 per square foot. 1241 Sharrott Run Place is a home located in Mahoning County with nearby schools including South Range Elementary School, South Range Middle School, and South Range High School.
Ownership History
Date
Name
Owned For
Owner Type
Purchase Details
Closed on
Nov 19, 2010
Sold by
Fossesca James J and Fossesca Hope M
Bought by
Fossesca Deena M
Current Estimated Value
Home Financials for this Owner
Home Financials are based on the most recent Mortgage that was taken out on this home.
Original Mortgage
$76,000
Outstanding Balance
$26,028
Interest Rate
4.17%
Mortgage Type
New Conventional
Estimated Equity
$469,610
Purchase Details
Closed on
May 10, 2002
Sold by
Noll Robert C and Noll Andrea L
Bought by
Fossesca James J and Fossesca Deena M
Home Financials for this Owner
Home Financials are based on the most recent Mortgage that was taken out on this home.
Original Mortgage
$135,000
Outstanding Balance
$57,286
Interest Rate
7%
Estimated Equity
$438,352
Purchase Details
Closed on
Jul 29, 1996
Sold by
Bertelli Homes Inc
Bought by
Noll Robert C and Noll Andrea L
Home Financials for this Owner
Home Financials are based on the most recent Mortgage that was taken out on this home.
Original Mortgage
$143,400
Interest Rate
8.43%
Mortgage Type
New Conventional
Create a Home Valuation Report for This Property
The Home Valuation Report is an in-depth analysis detailing your home's value as well as a comparison with similar homes in the area
Home Values in the Area
Average Home Value in this Area
Purchase History
| Date | Buyer | Sale Price | Title Company |
|---|---|---|---|
| Fossesca Deena M | -- | Attorney | |
| Fossesca James J | $193,000 | -- | |
| Noll Robert C | $169,900 | -- |
Source: Public Records
Mortgage History
| Date | Status | Borrower | Loan Amount |
|---|---|---|---|
| Open | Fossesca Deena M | $76,000 | |
| Open | Fossesca James J | $135,000 | |
| Closed | Noll Robert C | $143,400 |
Source: Public Records
Tax History Compared to Growth
Tax History
| Year | Tax Paid | Tax Assessment Tax Assessment Total Assessment is a certain percentage of the fair market value that is determined by local assessors to be the total taxable value of land and additions on the property. | Land | Improvement |
|---|---|---|---|---|
| 2024 | $6,208 | $128,070 | $13,650 | $114,420 |
| 2023 | $6,229 | $128,070 | $13,650 | $114,420 |
| 2022 | $6,263 | $111,900 | $13,650 | $98,250 |
| 2021 | $6,339 | $111,900 | $13,650 | $98,250 |
| 2020 | $6,367 | $111,900 | $13,650 | $98,250 |
| 2019 | $5,031 | $86,070 | $10,500 | $75,570 |
| 2018 | $4,963 | $86,070 | $10,500 | $75,570 |
| 2017 | $4,797 | $86,070 | $10,500 | $75,570 |
| 2016 | $4,634 | $78,370 | $10,500 | $67,870 |
| 2015 | $4,551 | $78,370 | $10,500 | $67,870 |
| 2014 | $4,602 | $78,370 | $10,500 | $67,870 |
| 2013 | $4,562 | $78,370 | $10,500 | $67,870 |
Source: Public Records
Map
Nearby Homes
- 11695 Basinger Rd
- 11216 Market St
- 11200 Market St
- 11541 South Ave
- 12977 South Ave
- 0 W Pine Lake Rd
- 1482 Lake Front Blvd
- 950 Country Manor Dr
- 1190 Calla Rd W
- 0 Sharrott Rd Unit 5174987
- 1 W Calla Rd
- 400 Calla Rd W
- 455 Via Avellino
- 13627 Market St
- 3555 W South Range Rd
- 0 Pine Lake Cove
- 1004 Waters Edge Dr Unit 1004
- 9264 Sharrott Rd Unit 1803
- 9264 Sharrott Rd Unit 1001
- 9264 Sharrott Rd Unit 104
- 1221 Sharrott Run Place
- 1261 Sharrott Run Place
- 1260 Sharrott Run Place
- 1161 Sharrott Run Place
- 1281 Sharrott Run Place
- 1160 Sharrott Run Place
- 1270 Sharrott Run Place
- 1131 Sharrott Run Place
- 1130 Sharrott Run Place
- 1280 Sharrott Run Place
- 1121 Sharrott Run Place
- 1290 Sharrott Run Place
- 1071 Sharrott Run Place
- 1200 W South Range Rd
- 1200 W South Range Rd
- 1051 Sharrott Run Place
- 1320 Sharrott Run Place
- 1390 W South Range Rd
- 1031 Sharrott Run Place
- 1171 Sharrott Creek Dr