1241 SW Chawla Ct Port Orchard, WA 98367
Estimated Value: $763,000 - $904,000
3
Beds
2
Baths
3,404
Sq Ft
$242/Sq Ft
Est. Value
About This Home
This home is located at 1241 SW Chawla Ct, Port Orchard, WA 98367 and is currently estimated at $822,906, approximately $241 per square foot. 1241 SW Chawla Ct is a home located in Kitsap County with nearby schools including Sidney Glen Elementary School, Cedar Heights Middle School, and South Kitsap High School.
Ownership History
Date
Name
Owned For
Owner Type
Purchase Details
Closed on
Feb 23, 2001
Sold by
Grimaud Ok Sun
Bought by
Grimaud Ok S and Chon Jin H
Current Estimated Value
Home Financials for this Owner
Home Financials are based on the most recent Mortgage that was taken out on this home.
Original Mortgage
$161,000
Interest Rate
6.98%
Purchase Details
Closed on
Jan 23, 2001
Sold by
Grimaud Richard C
Bought by
Grimaud Ok Sun
Home Financials for this Owner
Home Financials are based on the most recent Mortgage that was taken out on this home.
Original Mortgage
$161,000
Interest Rate
6.98%
Purchase Details
Closed on
Oct 12, 1994
Sold by
Cole Robert W and Cole Mona Y
Bought by
Grimaud Richard C and Grimaud Ok Sun
Home Financials for this Owner
Home Financials are based on the most recent Mortgage that was taken out on this home.
Original Mortgage
$160,000
Interest Rate
5.75%
Create a Home Valuation Report for This Property
The Home Valuation Report is an in-depth analysis detailing your home's value as well as a comparison with similar homes in the area
Home Values in the Area
Average Home Value in this Area
Purchase History
| Date | Buyer | Sale Price | Title Company |
|---|---|---|---|
| Grimaud Ok S | $76,253 | Land Title Company | |
| Grimaud Ok Sun | -- | -- | |
| Grimaud Richard C | $200,000 | Stewart Title Company |
Source: Public Records
Mortgage History
| Date | Status | Borrower | Loan Amount |
|---|---|---|---|
| Closed | Grimaud Ok S | $161,000 | |
| Closed | Grimaud Richard C | $160,000 |
Source: Public Records
Tax History Compared to Growth
Tax History
| Year | Tax Paid | Tax Assessment Tax Assessment Total Assessment is a certain percentage of the fair market value that is determined by local assessors to be the total taxable value of land and additions on the property. | Land | Improvement |
|---|---|---|---|---|
| 2026 | $6,823 | $787,640 | $167,920 | $619,720 |
| 2025 | $6,823 | $787,640 | $167,920 | $619,720 |
| 2024 | $6,616 | $787,640 | $167,920 | $619,720 |
| 2023 | $6,573 | $787,640 | $167,920 | $619,720 |
| 2022 | $6,276 | $629,630 | $133,850 | $495,780 |
| 2021 | $5,966 | $565,810 | $121,680 | $444,130 |
| 2020 | $6,201 | $571,870 | $105,030 | $466,840 |
| 2019 | $5,231 | $529,620 | $97,070 | $432,550 |
| 2018 | $5,566 | $429,060 | $83,550 | $345,510 |
| 2017 | $4,675 | $429,060 | $83,550 | $345,510 |
| 2016 | $4,531 | $380,240 | $79,570 | $300,670 |
| 2015 | $4,380 | $372,330 | $79,570 | $292,760 |
| 2014 | -- | $317,820 | $72,470 | $245,350 |
| 2013 | -- | $331,000 | $85,650 | $245,350 |
Source: Public Records
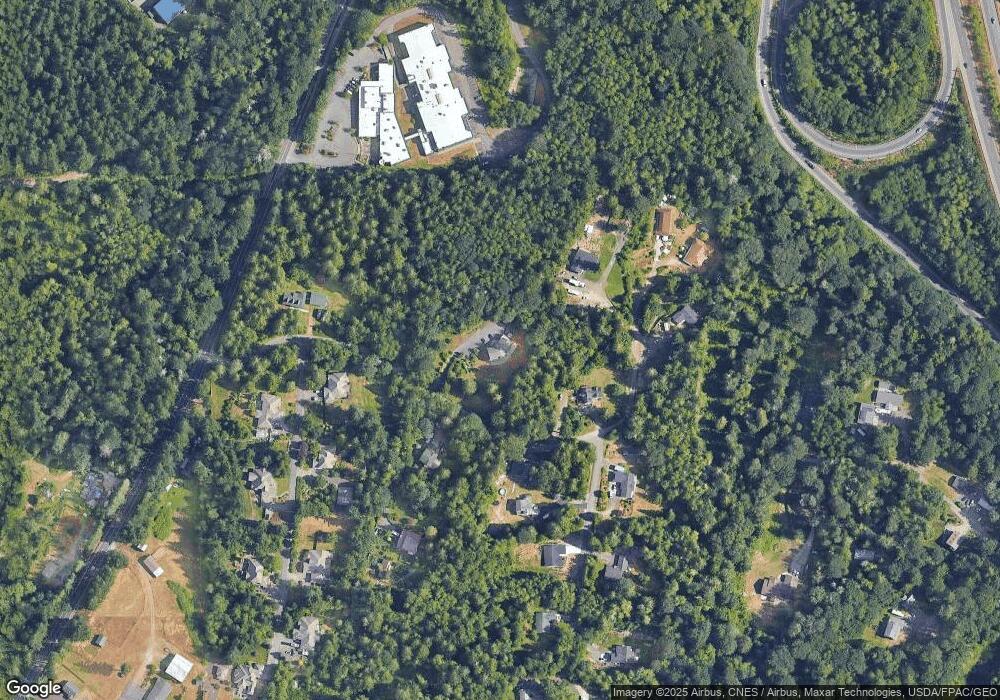
Map
Nearby Homes
- 1566 SW Old Clifton Rd
- 4595 Weyers Ln SW
- 2703 Anderson Hill Rd SW
- 155 May St W
- 2561 Anderson Hill Rd SW
- 171 SW Marcia Way
- 512 SW Berry Lake Rd Unit 15
- 4460 Castleton Rd SW
- 1885 SW Bay St
- 4510 Castleton Rd SW
- 3850 Portside Dr
- 122 Fireweed St
- 2430 Puget Sound Blvd
- 1160 Eagle Crest Place
- 280 Flower Meadows St
- 4715 Olivine Dr SW
- 4930 Castleton Rd SW
- 4710 Rutherford Cir SW
- 1277 Sherman Ave
- Powell Plan at Sinclair Ridge at McCormick - Sinclair Ridge
- 1221 SW Chawla Ct
- 1201 SW Chawla Ct
- 5141 Mccool Place SW
- 5150 Independence Place SW
- 0 Franway Ln SW
- 1220 SW Chawla Ct
- 5161 Mccool Place SW
- 5151 Independence Place SW
- 1270 SW Chawla Ct
- 1271 SW Chawla Ct
- 1200 SW Chawla Ct
- 5170 Independence Place SW
- 5171 Independence Place SW
- 5140 Mccool Place SW
- 5181 Mccool Place SW
- 5190 Independence Place SW
- 1360 SW Old Clifton Rd
- 1352 SW Old Clifton Rd
- 5160 Mccool Place SW
- 5191 Independence Place SW