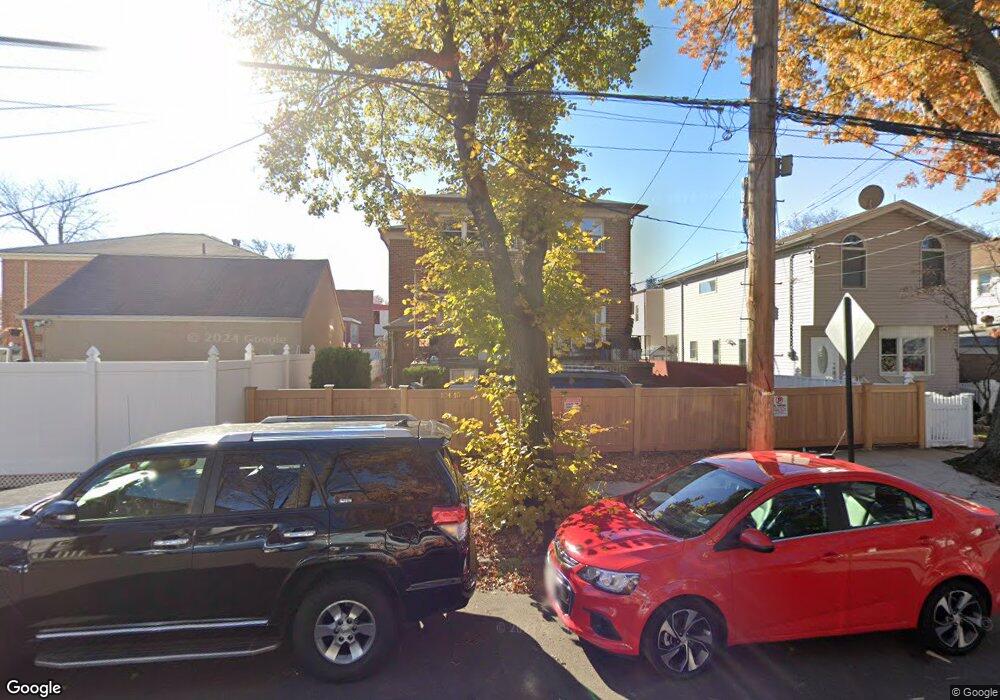
12410 9th Ave College Point, NY 11356
College Point NeighborhoodEstimated Value: $1,176,000 - $1,588,601
Studio
--
Bath
2,856
Sq Ft
$473/Sq Ft
Est. Value
About This Home
This home is located at 12410 9th Ave, College Point, NY 11356 and is currently estimated at $1,350,150, approximately $472 per square foot. 12410 9th Ave is a home located in Queens County with nearby schools including P.S. 129 Patricia Larkin, J.H.S. 194 William Carr, and Flushing High School.
Ownership History
Date
Name
Owned For
Owner Type
Purchase Details
Closed on
Jan 13, 2022
Sold by
Lin Qiao Xia and Zheng Xue Chen
Bought by
Zheng Xue Chen
Current Estimated Value
Purchase Details
Closed on
Sep 6, 2019
Sold by
Vormittag Francoise-Ramona
Bought by
Lin Qiao Xia and Zheng Xue Chen
Home Financials for this Owner
Home Financials are based on the most recent Mortgage that was taken out on this home.
Original Mortgage
$762,000
Outstanding Balance
$665,922
Interest Rate
3.7%
Mortgage Type
Purchase Money Mortgage
Estimated Equity
$684,228
Purchase Details
Closed on
Jan 4, 2013
Sold by
Estate Of Franz Formittag Deceased and Estate Of Franz Vormittag Deceased
Bought by
Vormittag Francoise-Ramona
Purchase Details
Closed on
Oct 20, 1995
Sold by
Vormittag Franz and Vormittag Elisabeth
Bought by
Vormittag Franz
Create a Home Valuation Report for This Property
The Home Valuation Report is an in-depth analysis detailing your home's value as well as a comparison with similar homes in the area
Home Values in the Area
Average Home Value in this Area
Purchase History
| Date | Buyer | Sale Price | Title Company |
|---|---|---|---|
| Zheng Xue Chen | -- | -- | |
| Zheng Xue Chen | -- | -- | |
| Zheng Xue Chen | -- | -- | |
| Lin Qiao Xia | $1,270,000 | -- | |
| Lin Qiao Xia | $1,270,000 | -- | |
| Vormittag Francoise-Ramona | -- | -- | |
| Vormittag Francoise-Ramona | -- | -- | |
| Vormittag Franz | -- | Commonwealth Land Title Ins | |
| Vormittag Franz | -- | Commonwealth Land Title Ins |
Source: Public Records
Mortgage History
| Date | Status | Borrower | Loan Amount |
|---|---|---|---|
| Open | Lin Qiao Xia | $762,000 | |
| Closed | Lin Qiao Xia | $762,000 |
Source: Public Records
Tax History
| Year | Tax Paid | Tax Assessment Tax Assessment Total Assessment is a certain percentage of the fair market value that is determined by local assessors to be the total taxable value of land and additions on the property. | Land | Improvement |
|---|---|---|---|---|
| 2025 | $13,673 | $72,163 | $13,806 | $58,357 |
| 2024 | $13,673 | $68,078 | $14,127 | $53,951 |
| 2023 | $13,561 | $67,520 | $13,091 | $54,429 |
| 2022 | $12,716 | $79,020 | $18,240 | $60,780 |
| 2021 | $13,406 | $77,160 | $18,240 | $58,920 |
| 2020 | $12,729 | $84,780 | $18,240 | $66,540 |
| 2019 | $11,868 | $83,760 | $18,240 | $65,520 |
| 2018 | $11,470 | $56,267 | $14,965 | $41,302 |
| 2017 | $10,821 | $53,083 | $15,561 | $37,522 |
| 2016 | $10,612 | $53,083 | $15,561 | $37,522 |
| 2015 | $5,820 | $50,113 | $15,784 | $34,329 |
| 2014 | $5,820 | $47,277 | $14,311 | $32,966 |
Source: Public Records
Map
Nearby Homes
- 12410 9th Ave Unit 1
- 12410 9th Ave Unit 2
- 12410 9th Ave
- 124-08 9th Ave
- 12408 9th Ave
- 9-06 125th St
- 906 125th St
- 902 125th St
- 9-08 125th St
- 12402 9th Ave
- 908 125th St
- 9-02 125th St
- 911 124th St
- 912 125th St
- 911 124th St
- 911 124th St Unit 2
- 911 124th St Unit 1 & B
- 911 124th St Unit 2 Fl
- 124-02 9th Ave Unit 2
- 914 125th St
Your Personal Tour Guide
Ask me questions while you tour the home.