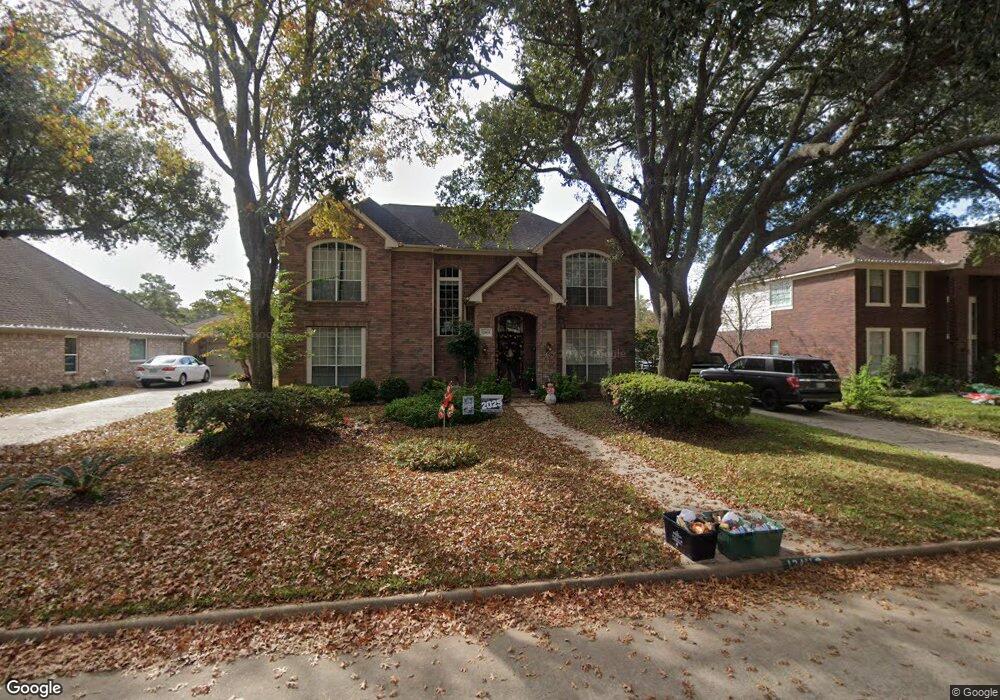
12411 Hammersmith Dr Tomball, TX 77377
Estimated Value: $396,000 - $429,928
4
Beds
3
Baths
2,923
Sq Ft
$142/Sq Ft
Est. Value
About This Home
This home is located at 12411 Hammersmith Dr, Tomball, TX 77377 and is currently estimated at $414,482, approximately $141 per square foot. 12411 Hammersmith Dr is a home located in Harris County with nearby schools including Lakewood Elementary School, Willow Wood Junior High School, and Northpointe Intermediate School.
Ownership History
Date
Name
Owned For
Owner Type
Purchase Details
Closed on
Aug 31, 2007
Sold by
Blanchard Catherine A and Blanchard Glenn
Bought by
Collins Dennis and Collins Buyankhishig Munkhbayar
Current Estimated Value
Purchase Details
Closed on
Sep 30, 2003
Sold by
Barnett Eddie Kevin and Barnett Patricia Gayle
Bought by
Blanchard Glenn and Blanchard Catherine A
Home Financials for this Owner
Home Financials are based on the most recent Mortgage that was taken out on this home.
Original Mortgage
$153,980
Interest Rate
6.24%
Mortgage Type
Purchase Money Mortgage
Purchase Details
Closed on
Apr 10, 1996
Sold by
Rodriguez Jerry L and Rodriguez Linda M
Bought by
Barnett Eddie Kevin and Barnett Patricia Gayle
Home Financials for this Owner
Home Financials are based on the most recent Mortgage that was taken out on this home.
Original Mortgage
$137,100
Interest Rate
7.42%
Create a Home Valuation Report for This Property
The Home Valuation Report is an in-depth analysis detailing your home's value as well as a comparison with similar homes in the area
Home Values in the Area
Average Home Value in this Area
Purchase History
| Date | Buyer | Sale Price | Title Company |
|---|---|---|---|
| Collins Dennis | -- | First American Title | |
| Blanchard Glenn | -- | Chicago Title 1960 | |
| Barnett Eddie Kevin | -- | Commonwealth Land Title Co |
Source: Public Records
Mortgage History
| Date | Status | Borrower | Loan Amount |
|---|---|---|---|
| Previous Owner | Blanchard Glenn | $153,980 | |
| Previous Owner | Barnett Eddie Kevin | $137,100 | |
| Closed | Blanchard Glenn | $28,871 |
Source: Public Records
Tax History Compared to Growth
Tax History
| Year | Tax Paid | Tax Assessment Tax Assessment Total Assessment is a certain percentage of the fair market value that is determined by local assessors to be the total taxable value of land and additions on the property. | Land | Improvement |
|---|---|---|---|---|
| 2025 | $2,556 | $399,000 | $73,792 | $325,208 |
| 2024 | $2,556 | $419,986 | $73,792 | $346,194 |
| 2023 | $2,556 | $433,668 | $71,359 | $362,309 |
| 2022 | $7,506 | $356,501 | $61,223 | $295,278 |
| 2021 | $7,128 | $293,042 | $44,600 | $248,442 |
| 2020 | $7,042 | $279,320 | $42,573 | $236,747 |
| 2019 | $7,213 | $277,528 | $37,553 | $239,975 |
| 2018 | $2,667 | $256,000 | $32,546 | $223,454 |
| 2017 | $6,642 | $256,000 | $32,546 | $223,454 |
| 2016 | $6,337 | $256,000 | $32,546 | $223,454 |
| 2015 | $4,835 | $256,000 | $32,546 | $223,454 |
| 2014 | $4,835 | $230,766 | $32,546 | $198,220 |
Source: Public Records
Map
Nearby Homes
- 12422 Hammersmith Dr
- 12407 Wealdstone Dr
- 12502 Wealdstone Dr
- 15826 Collinsville Dr
- 15843 Collinsville Dr
- 12906 Ivyforest Dr
- 12610 Ivyforest Dr
- 12411 Exbury Ct
- 12903 Cluster Pine Dr
- 12319 Hamsfield Ct
- 12915 Hunterfield Dr
- 12515 Pavilion Ct
- 12209 Medina Lake Dr
- 12923 Hunterfield Dr
- 12502 Pavilion Ct
- 12854 Highland Hills Dr
- 16012 Summerville Lake Dr
- 16610 Avenfield Rd
- 15975 W Bellefontaine Way
- 16107 Sweetwater Fields Ln Unit B1
- 12415 Hammersmith Dr
- 12407 Hammersmith Dr
- 12419 Hammersmith Dr
- 12403 Hammersmith Dr
- 12414 Hammersmith Dr
- 12410 Hammersmith Dr
- 12418 Hammersmith Dr
- 12406 Hammersmith Dr
- 12423 Hammersmith Dr
- 12323 Hammersmith Dr
- 12402 Hammersmith Dr
- 12427 Hammersmith Dr
- 12718 Chriswood Dr
- 12419 Wealdstone Dr
- 12415 Wealdstone Dr
- 12426 Hammersmith Dr
- 12319 Hammersmith Dr
- 12322 Hammersmith Dr
- 12714 Chriswood Dr
- 12423 Wealdstone Dr