Estimated Value: $361,000 - $421,926
4
Beds
3
Baths
2,744
Sq Ft
$142/Sq Ft
Est. Value
About This Home
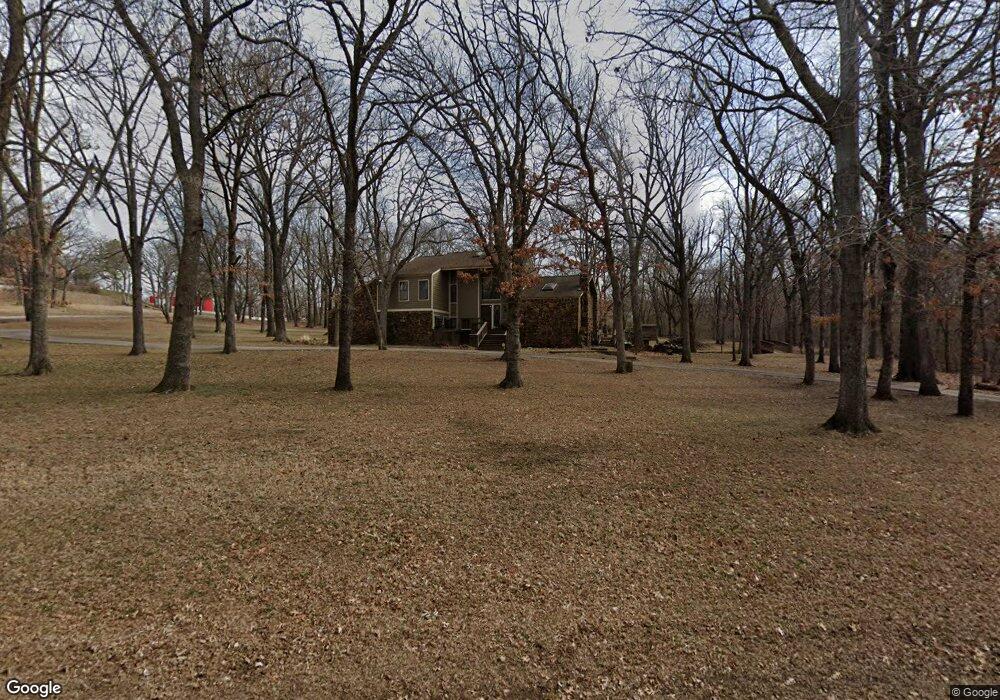
This home is located at 12411 S Florence, Jenks, OK 74037 and is currently estimated at $390,232, approximately $142 per square foot. 12411 S Florence is a home located in Tulsa County with nearby schools including Central Elementary School and Bixby Central Intermediate School.
Ownership History
Date
Name
Owned For
Owner Type
Purchase Details
Closed on
Jun 20, 2006
Sold by
Morrow Risa and Morrow Richard D
Bought by
Nelson Kevin R and Nelson Janel K
Current Estimated Value
Purchase Details
Closed on
Oct 23, 2001
Sold by
Jones Valerie and Morrow Risa
Bought by
Morrow Risa
Purchase Details
Closed on
May 18, 2000
Sold by
Stmad Charles M and Stmad Joy L
Bought by
Farrell Darlena M
Home Financials for this Owner
Home Financials are based on the most recent Mortgage that was taken out on this home.
Original Mortgage
$149,400
Interest Rate
8.19%
Mortgage Type
Purchase Money Mortgage
Purchase Details
Closed on
Jun 1, 1987
Create a Home Valuation Report for This Property
The Home Valuation Report is an in-depth analysis detailing your home's value as well as a comparison with similar homes in the area
Home Values in the Area
Average Home Value in this Area
Purchase History
| Date | Buyer | Sale Price | Title Company |
|---|---|---|---|
| Nelson Kevin R | $171,500 | None Available | |
| Morrow Risa | -- | -- | |
| Farrell Darlena M | $166,000 | Delta Title & Escrow Company | |
| -- | $110,000 | -- |
Source: Public Records
Mortgage History
| Date | Status | Borrower | Loan Amount |
|---|---|---|---|
| Previous Owner | Farrell Darlena M | $149,400 |
Source: Public Records
Tax History Compared to Growth
Tax History
| Year | Tax Paid | Tax Assessment Tax Assessment Total Assessment is a certain percentage of the fair market value that is determined by local assessors to be the total taxable value of land and additions on the property. | Land | Improvement |
|---|---|---|---|---|
| 2024 | $2,915 | $23,615 | $4,315 | $19,300 |
| 2023 | $2,915 | $23,897 | $4,509 | $19,388 |
| 2022 | $2,854 | $22,202 | $6,162 | $16,040 |
| 2021 | $2,803 | $21,526 | $5,974 | $15,552 |
| 2020 | $2,658 | $20,870 | $5,792 | $15,078 |
| 2019 | $2,594 | $20,233 | $5,615 | $14,618 |
| 2018 | $2,532 | $19,615 | $5,444 | $14,171 |
| 2017 | $2,414 | $20,014 | $5,555 | $14,459 |
| 2016 | $2,398 | $19,431 | $5,393 | $14,038 |
| 2015 | $2,369 | $18,865 | $5,236 | $13,629 |
| 2014 | $2,422 | $18,865 | $5,236 | $13,629 |
Source: Public Records
Map
Nearby Homes
- 12512 S 18th Cir E
- 2052 E 128th Place S
- 2104 E 128th Place S
- 2124 E 128th Place S
- 2058 E 129th St S
- 2067 E 129th Place S
- 12910 S 20th Place E
- 2039 E 129th Place S
- 13630 S 21st Place E
- 12925 S 21st Place E
- 13648 S 21st Place E
- 12917 S 21st Place E
- 13647 S 21st Place E
- 2068 E 129th Place S
- 12901 S 21st Place
- 12901 S 21st Place E
- 2077 E 130th St S
- 2056 E 129th Place S
- 2073 E 130th St S
- 2052 E 129th Place S
- 12381 S Florence
- 12501 S Florence
- 12426 S Florence
- 3150 E 124th St S
- 12371 S Florence
- 12502 S Florence
- 12396 S Florence
- 12551 S Florence
- 3131 E 126th St S
- 3141 E 124th St S
- 9414 S Gary Ave
- 8212 S Gary Ave
- 8226 S Gary Ave
- 8406 S Gary Ave
- 12200 S Florence Ave
- 12200 S Florence Ave
- 12200 S Florence Ave
- 12200 S Florence Ave
- 12418 S Gary Ave
- 7242 Gary S Unit 3B