Estimated Value: $250,000 - $298,000
3
Beds
3
Baths
1,498
Sq Ft
$177/Sq Ft
Est. Value
About This Home
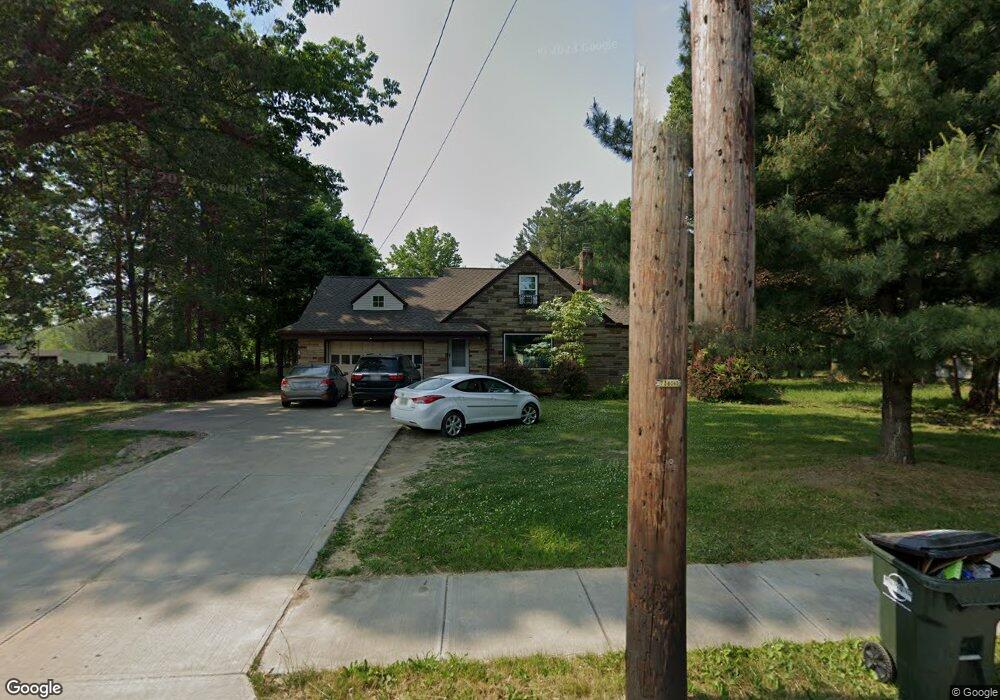
This home is located at 12413 W Pleasant Valley Rd, Parma, OH 44130 and is currently estimated at $264,467, approximately $176 per square foot. 12413 W Pleasant Valley Rd is a home located in Cuyahoga County with nearby schools including Pleasant Valley Elementary School, Greenbriar Middle School, and Valley Forge High School.
Ownership History
Date
Name
Owned For
Owner Type
Purchase Details
Closed on
Apr 4, 2006
Sold by
Kruzer Myra
Bought by
Snider William H
Current Estimated Value
Home Financials for this Owner
Home Financials are based on the most recent Mortgage that was taken out on this home.
Original Mortgage
$16,950
Outstanding Balance
$9,819
Interest Rate
6.5%
Mortgage Type
Unknown
Estimated Equity
$254,648
Purchase Details
Closed on
Feb 4, 2003
Sold by
Postlethwait George L
Bought by
Kruzer Myra
Home Financials for this Owner
Home Financials are based on the most recent Mortgage that was taken out on this home.
Original Mortgage
$65,000
Interest Rate
6.01%
Purchase Details
Closed on
Jan 2, 2001
Sold by
Estate Of Dorothy M Postlethwait
Bought by
Postlethwait George L
Purchase Details
Closed on
Jan 1, 1980
Bought by
Postlethwait Geo L and D M
Create a Home Valuation Report for This Property
The Home Valuation Report is an in-depth analysis detailing your home's value as well as a comparison with similar homes in the area
Home Values in the Area
Average Home Value in this Area
Purchase History
| Date | Buyer | Sale Price | Title Company |
|---|---|---|---|
| Snider William H | $169,500 | Boston Title | |
| Kruzer Myra | $142,000 | City Title Company | |
| Postlethwait George L | -- | -- | |
| Postlethwait Geo L | -- | -- |
Source: Public Records
Mortgage History
| Date | Status | Borrower | Loan Amount |
|---|---|---|---|
| Open | Snider William H | $16,950 | |
| Open | Snider William H | $135,600 | |
| Previous Owner | Kruzer Myra | $65,000 |
Source: Public Records
Tax History Compared to Growth
Tax History
| Year | Tax Paid | Tax Assessment Tax Assessment Total Assessment is a certain percentage of the fair market value that is determined by local assessors to be the total taxable value of land and additions on the property. | Land | Improvement |
|---|---|---|---|---|
| 2024 | $4,754 | $78,225 | $12,705 | $65,520 |
| 2023 | $3,802 | $53,310 | $10,260 | $43,050 |
| 2022 | $3,767 | $53,310 | $10,260 | $43,050 |
| 2021 | $3,876 | $53,310 | $10,260 | $43,050 |
| 2020 | $3,445 | $41,650 | $8,020 | $33,640 |
| 2019 | $3,309 | $119,000 | $22,900 | $96,100 |
| 2018 | $3,329 | $41,650 | $8,020 | $33,640 |
| 2017 | $3,199 | $37,310 | $5,460 | $31,850 |
| 2016 | $3,178 | $37,310 | $5,460 | $31,850 |
| 2015 | $3,020 | $37,310 | $5,460 | $31,850 |
| 2014 | $3,020 | $37,310 | $5,460 | $31,850 |
Source: Public Records
Map
Nearby Homes
- 12220 Zona Ln
- 7517 Zona Ln
- 12939 W Pleasant Valley Rd
- 7547 N Linden Ln
- 7330 Maplewood Rd
- 7230 Greenleaf Ave
- 11339 Gordon Dr
- 7601 W 130th St
- 7596 W 130th St
- 6988 Maplewood Rd
- 11533 Meadowbrook Dr
- 13541 Indian Creek Dr
- 11043 Meadowbrook Dr
- 7728 Klein Dr
- 12972 W Sprague Rd
- 7664 Gerald Dr
- 11609 Lawndale Dr
- 10260 Terrace Ct
- 11000 W Sprague Rd
- 11770 Barrington Blvd
- 12505 W Pleasant Valley Rd
- 12405 W Pleasant Valley Rd
- 12201 W Pleasant Valley Rd
- 12509 W Pleasant Valley Rd
- 12517 W Pleasant Valley Rd
- 12412 W Pleasant Valley Rd
- 12414 W Pleasant Valley Rd
- 12404 W Pleasant Valley Rd
- 12506 W Pleasant Valley Rd
- 12510 W Pleasant Valley Rd
- 7385 Parma Park Blvd
- 12516 W Pleasant Valley Rd
- 7377 Parma Park Blvd
- 7386 Parma Park Blvd
- 12181 W Pleasant Valley Rd
- 7486 Zona Ln
- 7371 Parma Park Blvd
- 12604 W Pleasant Valley Rd
- 7378 Parma Park Blvd
- 12260 Zona Ln