Estimated Value: $564,286 - $633,000
4
Beds
4
Baths
3,404
Sq Ft
$175/Sq Ft
Est. Value
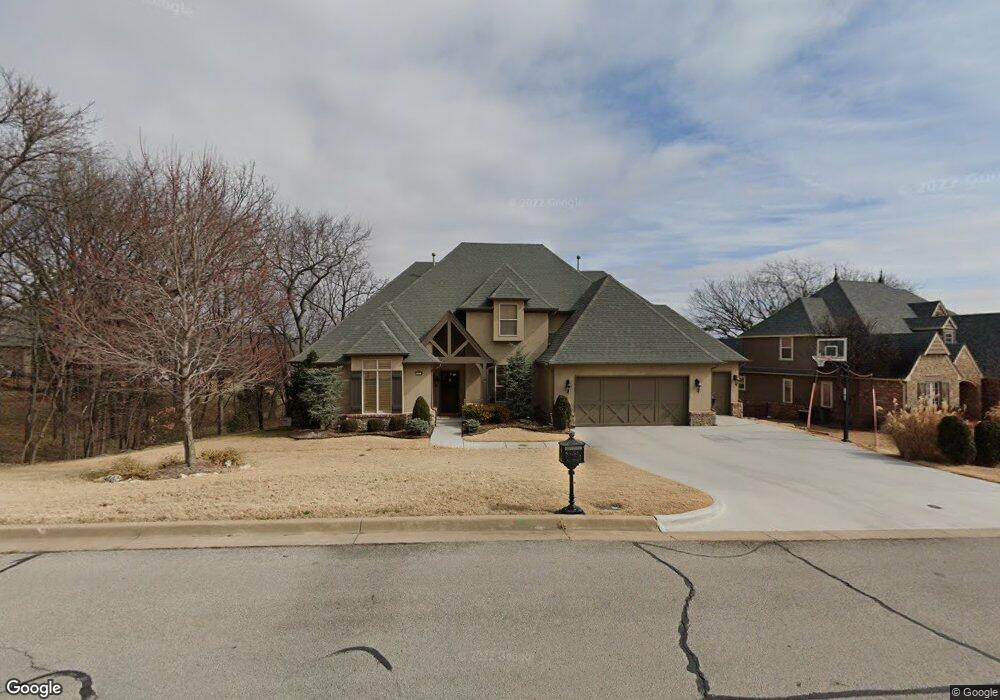
About This Home
This home is located at 12419 S 16th St, Jenks, OK 74037 and is currently estimated at $595,572, approximately $174 per square foot. 12419 S 16th St is a home located in Tulsa County with nearby schools including Central Elementary School, Bixby Central Intermediate School, and Bixby Middle School.
Ownership History
Date
Name
Owned For
Owner Type
Purchase Details
Closed on
Aug 18, 2020
Sold by
Allen Stgephen B and Allen Rachel E
Bought by
The Stephen And Rachel Allen Trust
Current Estimated Value
Purchase Details
Closed on
Mar 17, 2006
Sold by
Dean Christopoulos Construction Co Llc
Bought by
Allen Stephen B and Allen Rachel E
Home Financials for this Owner
Home Financials are based on the most recent Mortgage that was taken out on this home.
Original Mortgage
$292,000
Outstanding Balance
$163,835
Interest Rate
6.24%
Mortgage Type
Fannie Mae Freddie Mac
Estimated Equity
$431,737
Purchase Details
Closed on
Dec 15, 2004
Sold by
Southern Lakes Partners Llc
Bought by
Dean Christopoulos Construction Co Llc
Home Financials for this Owner
Home Financials are based on the most recent Mortgage that was taken out on this home.
Original Mortgage
$301,600
Interest Rate
5.71%
Mortgage Type
Purchase Money Mortgage
Create a Home Valuation Report for This Property
The Home Valuation Report is an in-depth analysis detailing your home's value as well as a comparison with similar homes in the area
Home Values in the Area
Average Home Value in this Area
Purchase History
| Date | Buyer | Sale Price | Title Company |
|---|---|---|---|
| The Stephen And Rachel Allen Trust | -- | None Available | |
| Allen Stephen B | $382,000 | None Available | |
| Dean Christopoulos Construction Co Llc | $70,000 | -- |
Source: Public Records
Mortgage History
| Date | Status | Borrower | Loan Amount |
|---|---|---|---|
| Open | Allen Stephen B | $292,000 | |
| Previous Owner | Dean Christopoulos Construction Co Llc | $301,600 |
Source: Public Records
Tax History
| Year | Tax Paid | Tax Assessment Tax Assessment Total Assessment is a certain percentage of the fair market value that is determined by local assessors to be the total taxable value of land and additions on the property. | Land | Improvement |
|---|---|---|---|---|
| 2025 | $6,581 | $53,555 | $6,871 | $46,684 |
| 2024 | $6,068 | $51,005 | $7,125 | $43,880 |
| 2023 | $6,068 | $48,576 | $7,291 | $41,285 |
| 2022 | $5,997 | $46,161 | $8,064 | $38,097 |
| 2021 | $6,001 | $46,161 | $8,064 | $38,097 |
| 2020 | $5,902 | $46,161 | $8,064 | $38,097 |
| 2019 | $5,955 | $46,161 | $8,064 | $38,097 |
| 2018 | $5,977 | $46,161 | $8,064 | $38,097 |
| 2017 | $5,974 | $47,161 | $8,239 | $38,922 |
| 2016 | $5,717 | $44,579 | $8,169 | $36,410 |
| 2015 | $5,321 | $44,961 | $8,239 | $36,722 |
| 2014 | $5,223 | $42,020 | $7,700 | $34,320 |
Source: Public Records
Map
Nearby Homes
- 12316 S 16th St
- 1629 E 124th St S
- 12511 S 18th Cir E
- 0 S 18th St
- 12512 S 18th Cir E
- 12514 S 18th Cir E
- 12231 S 18th Ave E
- 12225 S 14th Ct
- 12212 S 14th Ct
- 0 S 13th Place
- 1402 E 122nd Ct S
- 12116 S 14th Ct
- 12110 S 14th Ct
- 12636 S 13th Place
- 12207 S 12th Ct
- 0 S 14th Ave
- 11900 S 18th St E
- 721 E 125th Place S
- 12425 S Gary Ave
- 11926 S 14th Ct
- 12423 S 16th St
- 0 S 16th St Unit 302099
- 0 S 16th St Unit 213894
- 0 S 16th St Unit 1603351
- 0 S 16th St Unit 1631973
- 0 S 16th St Unit 1707966
- 0 S 16th St Unit 1734009
- 12427 S 16th St
- 1610 E 124th St S
- 12430 S 16th St E
- 12430 S 16th St
- 12414 S 16th St
- 1618 E 124th St S
- 1602 E 124th St S
- 12431 S 16th St
- 1626 E 124th St S
- 12410 S 16th St
- 12422 S 16th St
- 12418 S 16th St
- 12426 S 16th St
Your Personal Tour Guide
Ask me questions while you tour the home.