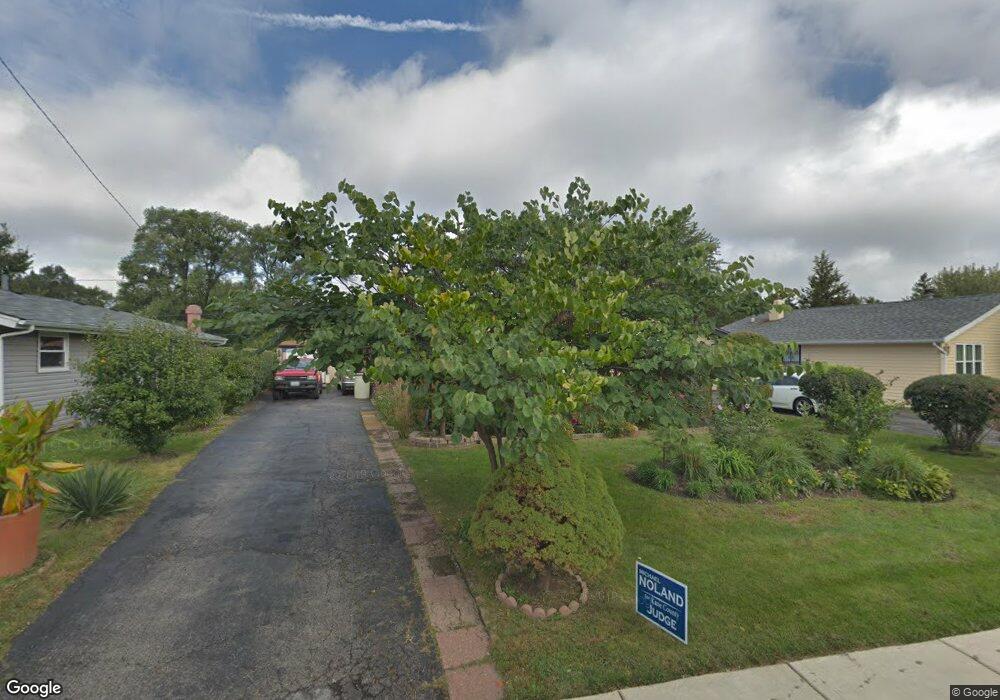
1242 Navajo Dr Unit 5 Carpentersville, IL 60110
Estimated Value: $251,885 - $282,000
3
Beds
--
Bath
1,036
Sq Ft
$256/Sq Ft
Est. Value
About This Home
This home is located at 1242 Navajo Dr Unit 5, Carpentersville, IL 60110 and is currently estimated at $265,721, approximately $256 per square foot. 1242 Navajo Dr Unit 5 is a home located in Kane County with nearby schools including Sunny Hill Elementary School, Barrington Mdle School- Prairie Cmps, and Barrington High School.
Ownership History
Date
Name
Owned For
Owner Type
Purchase Details
Closed on
Jun 24, 2022
Sold by
Jorge Lopez
Bought by
Lopez Jorge and Lopez Belen
Current Estimated Value
Home Financials for this Owner
Home Financials are based on the most recent Mortgage that was taken out on this home.
Original Mortgage
$100,000
Outstanding Balance
$83,655
Interest Rate
4.5%
Mortgage Type
New Conventional
Estimated Equity
$182,066
Purchase Details
Closed on
Jul 1, 1999
Sold by
Lopez Jorge and Arreola Jose
Bought by
Lopez Jorge
Purchase Details
Closed on
Feb 26, 1997
Sold by
Wiley Gerold and Wiley Alice Lee
Bought by
Lopez Jorge and Arreola Jose
Home Financials for this Owner
Home Financials are based on the most recent Mortgage that was taken out on this home.
Original Mortgage
$93,763
Interest Rate
7.93%
Mortgage Type
FHA
Create a Home Valuation Report for This Property
The Home Valuation Report is an in-depth analysis detailing your home's value as well as a comparison with similar homes in the area
Home Values in the Area
Average Home Value in this Area
Purchase History
| Date | Buyer | Sale Price | Title Company |
|---|---|---|---|
| Lopez Jorge | -- | Greater Illinois Title | |
| Lopez Jorge | -- | -- | |
| Lopez Jorge | $94,500 | Golden Title |
Source: Public Records
Mortgage History
| Date | Status | Borrower | Loan Amount |
|---|---|---|---|
| Open | Lopez Jorge | $100,000 | |
| Previous Owner | Lopez Jorge | $93,763 |
Source: Public Records
Tax History Compared to Growth
Tax History
| Year | Tax Paid | Tax Assessment Tax Assessment Total Assessment is a certain percentage of the fair market value that is determined by local assessors to be the total taxable value of land and additions on the property. | Land | Improvement |
|---|---|---|---|---|
| 2024 | $4,909 | $71,519 | $12,553 | $58,966 |
| 2023 | $4,658 | $64,351 | $11,295 | $53,056 |
| 2022 | $4,217 | $55,091 | $11,295 | $43,796 |
| 2021 | $4,041 | $52,017 | $10,665 | $41,352 |
| 2020 | $3,849 | $50,847 | $10,425 | $40,422 |
| 2019 | $3,623 | $48,270 | $9,897 | $38,373 |
| 2018 | $3,261 | $42,438 | $9,701 | $32,737 |
| 2017 | $3,014 | $39,699 | $9,075 | $30,624 |
| 2016 | $2,647 | $34,152 | $8,787 | $25,365 |
| 2015 | -- | $28,488 | $8,234 | $20,254 |
| 2014 | -- | $25,592 | $8,007 | $17,585 |
| 2013 | -- | $26,375 | $8,252 | $18,123 |
Source: Public Records
Map
Nearby Homes
- 336 Delaware St
- 944 Cortney Dr
- 103 Hickory Dr
- 140 Hickory Dr
- 94 Wren Rd
- 57 Robin Rd
- 155 Helm Rd
- 1426 Kings Rd
- 153 Algonquin Rd
- 105 Siesta Rd
- 1811 IL Rte 25 (Elgin) Rd
- 7 Autumn Trail
- 7 Hickory Dr
- 200 Amarillo Dr
- 2013 Silverstone Dr Unit 2013
- 7 Austin Ave
- 308 Amarillo Ct
- 4 Austin Ave
- 2245 Flagstone Ln Unit 155
- 1431 Silverstone Dr Unit 1416
- 1244 Navajo Dr
- 1240 Navajo Dr
- 1246 Navajo Dr Unit 5
- 1238 Navajo Dr
- 1248 Navajo Dr Unit 5
- 1235 Navajo Dr
- 1236 Navajo Dr
- 1433 Indian Ln
- 1239 Navajo Dr
- 1431 Indian Ln
- 1435 Indian Ln
- 1250 Navajo Dr
- 1429 Indian Ln
- 1234 Navajo Dr
- 1233 Navajo Dr
- 1427 Indian Ln
- 1252 Navajo Dr Unit 5
- 1241 Navajo Dr
- 1243 Navajo Dr
- 1232 Navajo Dr