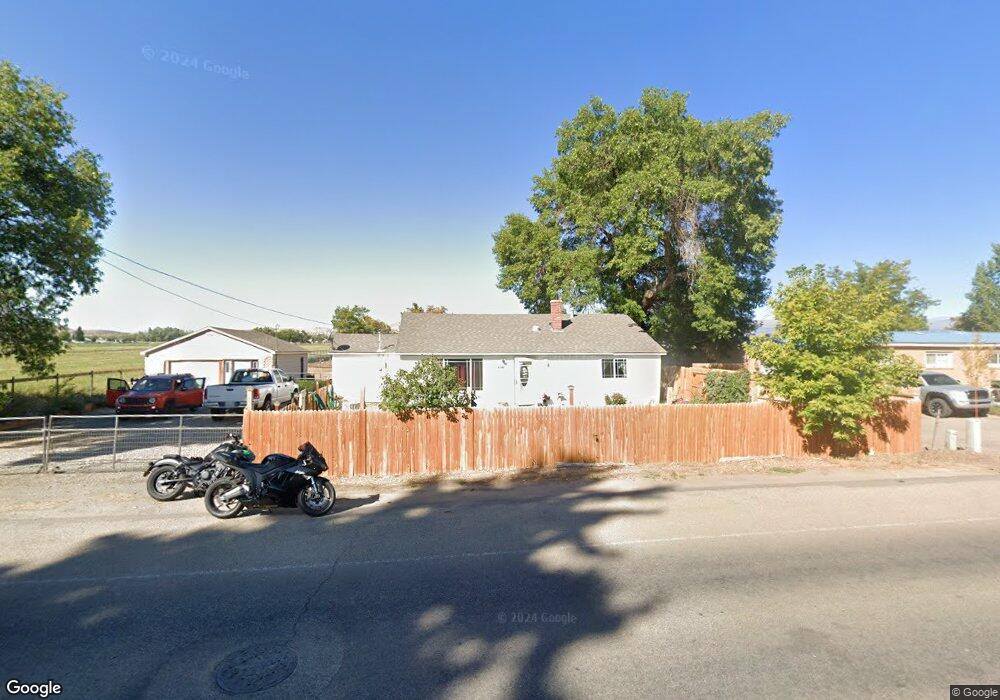
1242 S Vernal Ave Vernal, UT 84078
Estimated Value: $275,000 - $334,000
2
Beds
1
Bath
1,279
Sq Ft
$235/Sq Ft
Est. Value
About This Home
This home is located at 1242 S Vernal Ave, Vernal, UT 84078 and is currently estimated at $300,216, approximately $234 per square foot. 1242 S Vernal Ave is a home located in Uintah County with nearby schools including Discovery School, Vernal Middle School, and Uintah Middle School.
Ownership History
Date
Name
Owned For
Owner Type
Purchase Details
Closed on
Nov 15, 2017
Sold by
Eldridge Laura K
Bought by
Eldridge Laura Kay
Current Estimated Value
Purchase Details
Closed on
Nov 14, 2017
Sold by
Secretary Housing Urban Development
Bought by
Eldridge Laura K
Purchase Details
Closed on
Jul 25, 2017
Sold by
Guild Mortgage Company
Bought by
Secretary Housing Urban Development
Purchase Details
Closed on
Nov 23, 2016
Sold by
Etitle Insurance Agency
Bought by
Guild Mortgage Company
Purchase Details
Closed on
Jul 27, 2006
Sold by
Long Nancy E
Bought by
Brown Mark R
Home Financials for this Owner
Home Financials are based on the most recent Mortgage that was taken out on this home.
Original Mortgage
$135,000
Interest Rate
9.25%
Mortgage Type
Adjustable Rate Mortgage/ARM
Create a Home Valuation Report for This Property
The Home Valuation Report is an in-depth analysis detailing your home's value as well as a comparison with similar homes in the area
Home Values in the Area
Average Home Value in this Area
Purchase History
| Date | Buyer | Sale Price | Title Company |
|---|---|---|---|
| Eldridge Laura Kay | -- | Basin Land Title | |
| Eldridge Laura K | -- | Basin Land Title | |
| Secretary Housing Urban Development | -- | None Available | |
| Guild Mortgage Company | $110,920 | None Available | |
| Brown Mark R | -- | -- | |
| Long Nancy E | -- | -- |
Source: Public Records
Mortgage History
| Date | Status | Borrower | Loan Amount |
|---|---|---|---|
| Previous Owner | Brown Mark R | $135,000 | |
| Closed | Guild Mortgage Company | $0 |
Source: Public Records
Tax History Compared to Growth
Tax History
| Year | Tax Paid | Tax Assessment Tax Assessment Total Assessment is a certain percentage of the fair market value that is determined by local assessors to be the total taxable value of land and additions on the property. | Land | Improvement |
|---|---|---|---|---|
| 2024 | $1,160 | $138,080 | $33,425 | $104,655 |
| 2023 | $1,160 | $126,019 | $29,212 | $96,807 |
| 2022 | $1,101 | $106,658 | $29,212 | $77,446 |
| 2021 | $1,159 | $92,176 | $29,212 | $62,964 |
| 2020 | $1,128 | $92,176 | $29,212 | $62,964 |
| 2019 | $963 | $77,719 | $24,750 | $52,969 |
| 2018 | $930 | $75,197 | $24,750 | $50,447 |
| 2017 | $9 | $77,947 | $27,500 | $50,447 |
| 2016 | $961 | $85,285 | $27,500 | $57,785 |
| 2015 | $917 | $88,327 | $27,500 | $60,827 |
| 2014 | $876 | $85,430 | $27,500 | $57,930 |
| 2013 | $895 | $85,430 | $27,500 | $57,930 |
Source: Public Records
Map
Nearby Homes
- 1226 S Vernal Ave
- 1255 S Vernal Ave
- 1200 S Vernal Ave
- 1239 S Vernal Ave
- 1074 S Vernal Ave
- 1178 S Vernal Ave
- 1178 S Vernal Ave
- 18 E 1150 S
- 18/22 E 1150 S
- 1293 S Vernal Ave
- 1293 S Vernal Ave
- 1154 S Vernal Ave
- 34 E 1150 S
- 60 E 1150 S
- 56/60 E 1150 S
- 1140 S Vernal Ave
- 1337 S Vernal Ave
- 1137 S Vernal Ave
- 78 E 1150 S
- 74 E 1150 S Unit 74, 78