Estimated Value: $297,000 - $318,000
3
Beds
2
Baths
1,676
Sq Ft
$185/Sq Ft
Est. Value
About This Home
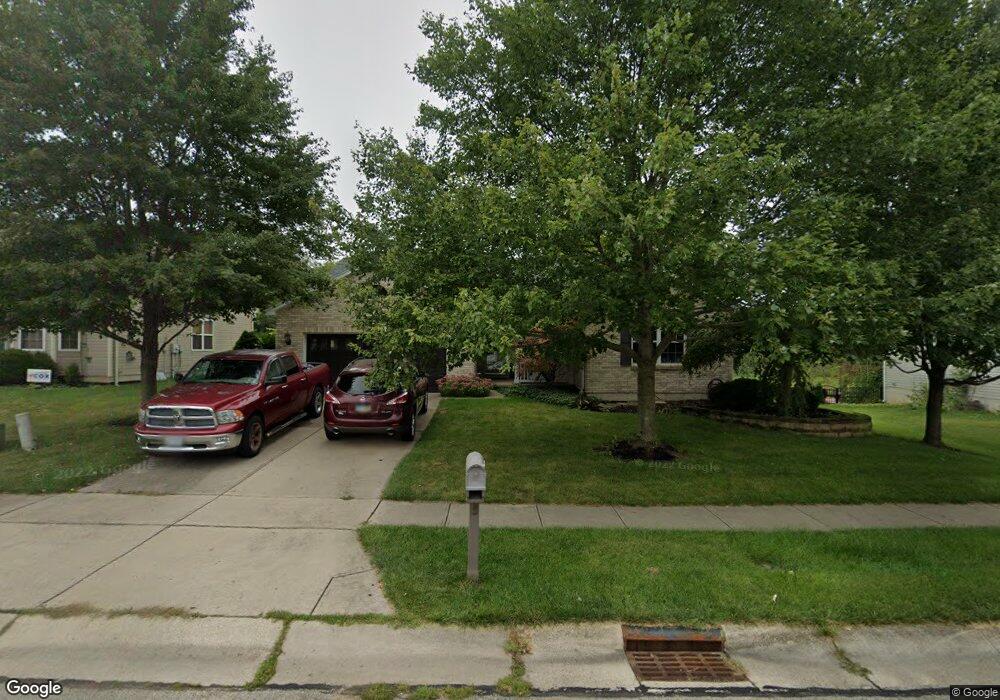
This home is located at 1242 Shannon Ln, Xenia, OH 45385 and is currently estimated at $309,289, approximately $184 per square foot. 1242 Shannon Ln is a home located in Greene County with nearby schools including Xenia High School and Summit Academy Community School for Alternative Learners - Xenia.
Ownership History
Date
Name
Owned For
Owner Type
Purchase Details
Closed on
Jul 27, 2015
Sold by
Mccarren Laura D
Bought by
Mccarren Laura D and Singer Raymond Scott
Current Estimated Value
Home Financials for this Owner
Home Financials are based on the most recent Mortgage that was taken out on this home.
Original Mortgage
$62,000
Interest Rate
4.01%
Mortgage Type
New Conventional
Purchase Details
Closed on
Jan 11, 2008
Sold by
Fannin Philip L and Garcia Rebecca A
Bought by
Fannin Ii Philip L and Garcia Rebecca A
Purchase Details
Closed on
Oct 29, 2001
Sold by
Crossman Communities Of Ohio Inc
Bought by
Fannin Ii Philip L
Home Financials for this Owner
Home Financials are based on the most recent Mortgage that was taken out on this home.
Original Mortgage
$155,780
Interest Rate
6.69%
Create a Home Valuation Report for This Property
The Home Valuation Report is an in-depth analysis detailing your home's value as well as a comparison with similar homes in the area
Home Values in the Area
Average Home Value in this Area
Purchase History
| Date | Buyer | Sale Price | Title Company |
|---|---|---|---|
| Mccarren Laura D | -- | Attorney | |
| Mccarren Laura D | $212,000 | Attorney | |
| Fannin Ii Philip L | -- | Attorney | |
| Fannin Ii Philip L | $41,450 | -- |
Source: Public Records
Mortgage History
| Date | Status | Borrower | Loan Amount |
|---|---|---|---|
| Previous Owner | Mccarren Laura D | $62,000 | |
| Previous Owner | Fannin Ii Philip L | $155,780 |
Source: Public Records
Tax History Compared to Growth
Tax History
| Year | Tax Paid | Tax Assessment Tax Assessment Total Assessment is a certain percentage of the fair market value that is determined by local assessors to be the total taxable value of land and additions on the property. | Land | Improvement |
|---|---|---|---|---|
| 2024 | $3,605 | $84,240 | $26,340 | $57,900 |
| 2023 | $3,605 | $84,240 | $26,340 | $57,900 |
| 2022 | $3,140 | $62,600 | $17,560 | $45,040 |
| 2021 | $3,183 | $62,600 | $17,560 | $45,040 |
| 2020 | $2,969 | $62,600 | $17,560 | $45,040 |
| 2019 | $2,422 | $48,050 | $11,260 | $36,790 |
| 2018 | $2,431 | $48,050 | $11,260 | $36,790 |
| 2017 | $2,360 | $48,050 | $11,260 | $36,790 |
| 2016 | $2,391 | $46,410 | $11,260 | $35,150 |
| 2015 | $2,464 | $46,410 | $11,260 | $35,150 |
| 2014 | $2,359 | $46,410 | $11,260 | $35,150 |
Source: Public Records
Map
Nearby Homes
- 1248 Prem Place
- 1293 Baybury Ave
- 1213 Prem Place
- 1272 Baybury Ave
- 1292 Baybury Ave
- 2705 Tennessee Dr
- 2685 Childers Dr
- 1474 Hawkshead St
- 2852 Raxit Ct
- 2692 Kingman Dr
- Henley Plan at Edenbridge
- Holcombe Plan at Edenbridge
- Newcastle Plan at Edenbridge
- Bellamy Plan at Edenbridge
- Chatham Plan at Edenbridge
- 0 Berkshire Dr Unit 942854
- 2265 Minnesota Dr
- 2421 Louisiana Dr
- 2540 Jenny Marie Dr
- 2540 Cornwall Dr
- 1250 Shannon Ln
- 1215 Shannon Ln
- 1217 Shannon Ln
- 1236 Shannon Ln
- 1260 Shannon Ln
- 1235 Shannon Ln
- 1223 Shannon Ln
- 1230 Shannon Ln
- 1241 Shannon Ln
- 1253 Shannon Ln
- 1231 Shannon Ln
- 1270 Shannon Ln
- 1224 Shannon Ln
- 1278 Shannon Ln
- 3026 W Barnhill Place
- 1225 Shannon Ln
- 1283 Shannon Ln
- 1214 Shannon Ln
- 1286 Shannon Ln
- 1219 Shannon Ln