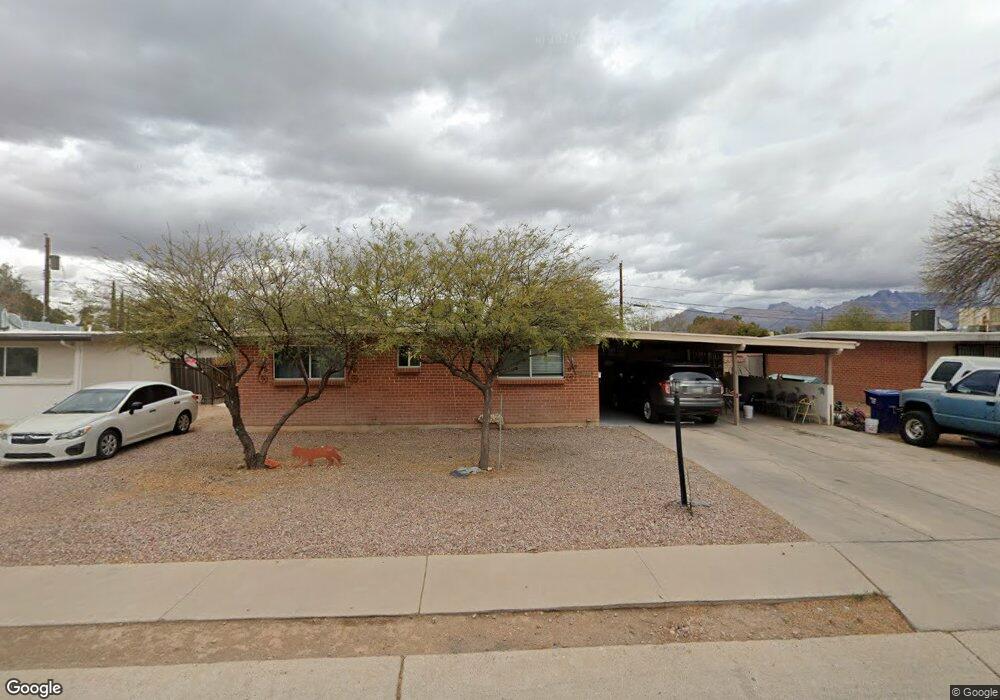
1242 W Pelaar St Tucson, AZ 85705
Flowing Wells NeighborhoodEstimated Value: $271,000 - $279,000
4
Beds
2
Baths
1,581
Sq Ft
$174/Sq Ft
Est. Value
About This Home
This home is located at 1242 W Pelaar St, Tucson, AZ 85705 and is currently estimated at $274,718, approximately $173 per square foot. 1242 W Pelaar St is a home located in Pima County with nearby schools including Flowing Wells Junior High School, Flowing Wells High School, and Academy Del Sol - Roger Road.
Ownership History
Date
Name
Owned For
Owner Type
Purchase Details
Closed on
Apr 14, 2010
Sold by
Jean Lisa and Shea Lisa
Bought by
Murillo Margarita
Current Estimated Value
Home Financials for this Owner
Home Financials are based on the most recent Mortgage that was taken out on this home.
Original Mortgage
$122,710
Outstanding Balance
$83,727
Interest Rate
5.5%
Mortgage Type
FHA
Estimated Equity
$190,991
Purchase Details
Closed on
Jan 15, 2008
Sold by
Shea Matthew T
Bought by
Jenn Lisa and Shea Lisa
Purchase Details
Closed on
Feb 28, 2005
Sold by
Shea Lisa and Abbinante Lisa Jenn
Bought by
Shea Matthew T and Shea Lisa
Purchase Details
Closed on
May 30, 2000
Sold by
Abbinante Michael C
Bought by
Abbinante Lisa Jenn
Purchase Details
Closed on
May 22, 2000
Sold by
Jenn Vern
Bought by
Jenn Vern and Abbinante Lisa Jenn
Purchase Details
Closed on
Jan 25, 1997
Sold by
Decastro Karen and Graeff Karen E
Bought by
Jenn Vern L
Create a Home Valuation Report for This Property
The Home Valuation Report is an in-depth analysis detailing your home's value as well as a comparison with similar homes in the area
Home Values in the Area
Average Home Value in this Area
Purchase History
| Date | Buyer | Sale Price | Title Company |
|---|---|---|---|
| Murillo Margarita | $125,000 | Longt | |
| Murillo Margarita | $125,000 | Longt | |
| Jenn Lisa | -- | None Available | |
| Shea Matthew T | -- | -- | |
| Abbinante Lisa Jenn | -- | -- | |
| Jenn Vern | -- | -- | |
| Jenn Vern L | -- | -- |
Source: Public Records
Mortgage History
| Date | Status | Borrower | Loan Amount |
|---|---|---|---|
| Open | Murillo Margarita | $122,710 | |
| Closed | Murillo Margarita | $122,710 |
Source: Public Records
Tax History Compared to Growth
Tax History
| Year | Tax Paid | Tax Assessment Tax Assessment Total Assessment is a certain percentage of the fair market value that is determined by local assessors to be the total taxable value of land and additions on the property. | Land | Improvement |
|---|---|---|---|---|
| 2025 | $1,830 | $13,562 | -- | -- |
| 2024 | $1,830 | $12,917 | -- | -- |
| 2023 | $1,714 | $12,302 | $0 | $0 |
| 2022 | $1,714 | $11,716 | $0 | $0 |
| 2021 | $1,671 | $10,627 | $0 | $0 |
| 2020 | $1,638 | $10,627 | $0 | $0 |
| 2019 | $1,611 | $15,125 | $0 | $0 |
| 2018 | $1,556 | $9,180 | $0 | $0 |
| 2017 | $1,500 | $9,180 | $0 | $0 |
| 2016 | $1,444 | $8,743 | $0 | $0 |
| 2015 | $1,359 | $8,326 | $0 | $0 |
Source: Public Records
Map
Nearby Homes
- 1339 W Pastime Rd
- 1150 W Prince Rd Unit 49
- 1150 W Prince Rd Unit 17
- 3922 N Palm Grove Dr
- 3833 N Fairview Ave Unit 32
- 3833 N Fairview Ave Unit 98
- 3833 N Fairview Ave Unit 126
- 3833 N Fairview Ave Unit 124
- 3833 N Fairview Ave Unit 118
- 3833 N Fairview Ave Unit 10
- 3833 N Fairview Ave Unit 113
- 3833 N Fairview Ave Unit 75
- 3833 N Fairview Ave Unit 88
- 3833 N Fairview Ave Unit 69
- 3833 N Fairview Ave Unit 54
- 3833 N Fairview Ave Unit 68
- 1456 W Knox St
- 1015 W Cll Arizona
- 848 W Thurber Rd
- 4118 N Palm Grove Dr
- 1252 W Pelaar St
- 1232 W Pelaar St
- 1231 W Smoot Place
- 1241 W Smoot Place
- 1262 W Pelaar St
- 1222 W Pelaar St
- 1241 W Pelaar St
- 1221 W Smoot Place
- 1231 W Pelaar St
- 1251 W Pelaar St
- 1221 W Pelaar St
- 1212 W Pelaar St
- 1261 W Pelaar St
- 1272 W Pelaar St
- 1261 W Smoot Place
- 1211 W Pelaar St
- 1271 W Pelaar St
- 1202 W Pelaar St
- 1232 W Smoot Place
- 1242 W Smoot Place