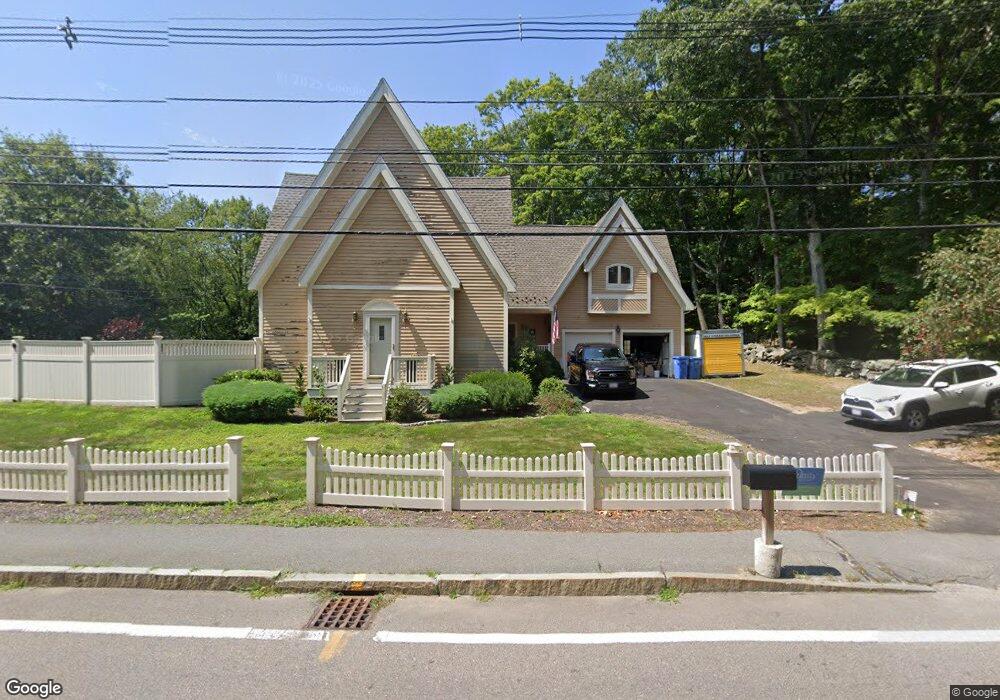
1242 West St Wrentham, MA 02093
West Wrentham NeighborhoodEstimated Value: $669,000 - $818,088
3
Beds
3
Baths
2,586
Sq Ft
$294/Sq Ft
Est. Value
About This Home
This home is located at 1242 West St, Wrentham, MA 02093 and is currently estimated at $761,272, approximately $294 per square foot. 1242 West St is a home located in Norfolk County with nearby schools including Delaney Elementary School, Charles E Roderick, and Mercymount Country Day School.
Ownership History
Date
Name
Owned For
Owner Type
Purchase Details
Closed on
Jun 7, 2000
Sold by
Devincent Stephen M and Devincent Maryellen
Bought by
Fifolt Douglas A and Fifolt Marguerite W
Current Estimated Value
Create a Home Valuation Report for This Property
The Home Valuation Report is an in-depth analysis detailing your home's value as well as a comparison with similar homes in the area
Home Values in the Area
Average Home Value in this Area
Purchase History
| Date | Buyer | Sale Price | Title Company |
|---|---|---|---|
| Fifolt Douglas A | $287,500 | -- |
Source: Public Records
Mortgage History
| Date | Status | Borrower | Loan Amount |
|---|---|---|---|
| Closed | Fifolt Douglas A | $219,000 | |
| Closed | Fifolt Douglas A | $231,000 |
Source: Public Records
Tax History Compared to Growth
Tax History
| Year | Tax Paid | Tax Assessment Tax Assessment Total Assessment is a certain percentage of the fair market value that is determined by local assessors to be the total taxable value of land and additions on the property. | Land | Improvement |
|---|---|---|---|---|
| 2025 | $7,821 | $674,800 | $263,300 | $411,500 |
| 2024 | $7,907 | $658,900 | $263,300 | $395,600 |
| 2023 | $8,021 | $635,600 | $239,200 | $396,400 |
| 2022 | $6,750 | $493,800 | $232,600 | $261,200 |
| 2021 | $7,418 | $527,200 | $217,400 | $309,800 |
| 2020 | $6,703 | $470,400 | $165,900 | $304,500 |
| 2019 | $6,624 | $469,100 | $149,300 | $319,800 |
| 2018 | $6,173 | $433,500 | $149,500 | $284,000 |
| 2017 | $6,043 | $424,100 | $146,600 | $277,500 |
| 2016 | $5,920 | $414,600 | $142,400 | $272,200 |
| 2015 | $6,121 | $408,600 | $152,100 | $256,500 |
| 2014 | $6,041 | $394,600 | $146,300 | $248,300 |
Source: Public Records
Map
Nearby Homes