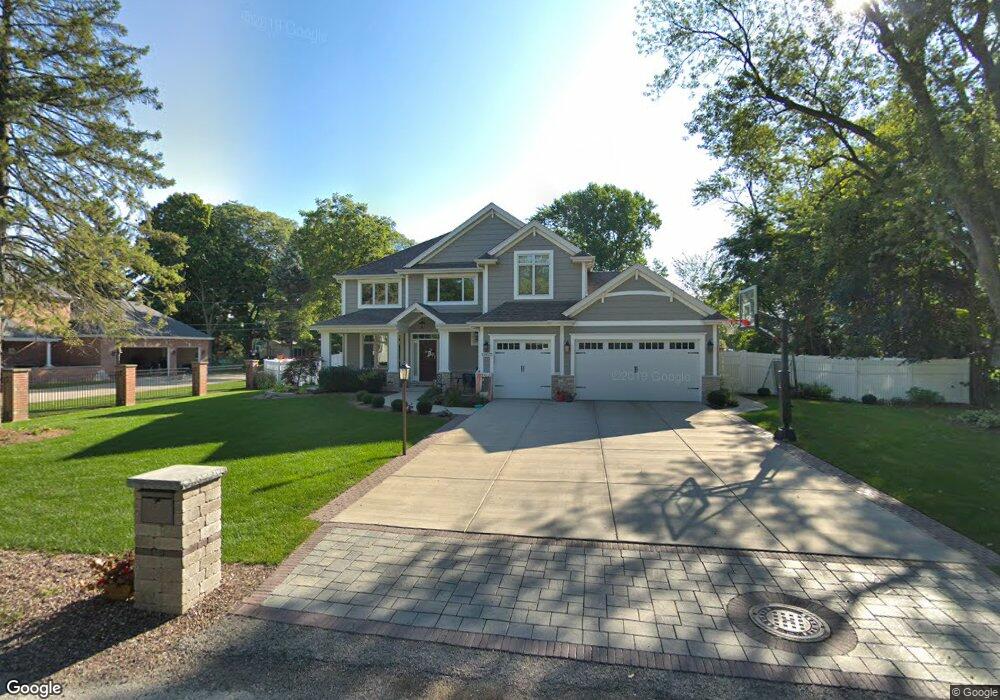
12423 S 73rd Ave Palos Heights, IL 60463
Ishnala NeighborhoodEstimated Value: $583,000 - $898,000
5
Beds
5
Baths
3,642
Sq Ft
$212/Sq Ft
Est. Value
About This Home
This home is located at 12423 S 73rd Ave, Palos Heights, IL 60463 and is currently estimated at $772,939, approximately $212 per square foot. 12423 S 73rd Ave is a home located in Cook County with nearby schools including Palos East Elementary School, Palos South Middle School, and Amos Alonzo Stagg High School.
Ownership History
Date
Name
Owned For
Owner Type
Purchase Details
Closed on
Feb 13, 2015
Sold by
Flaherty Builders Incorporated
Bought by
Burzycki Mark and Burzycki Angela
Current Estimated Value
Home Financials for this Owner
Home Financials are based on the most recent Mortgage that was taken out on this home.
Original Mortgage
$350,000
Outstanding Balance
$266,681
Interest Rate
3.62%
Mortgage Type
New Conventional
Estimated Equity
$506,258
Purchase Details
Closed on
Feb 11, 2015
Sold by
Avenue Homes Ltd
Bought by
Flaherty Builders Incorporated
Home Financials for this Owner
Home Financials are based on the most recent Mortgage that was taken out on this home.
Original Mortgage
$350,000
Outstanding Balance
$266,681
Interest Rate
3.62%
Mortgage Type
New Conventional
Estimated Equity
$506,258
Purchase Details
Closed on
Dec 18, 2006
Sold by
Kraywinkel Howard
Bought by
Avenue Homes Ltd
Home Financials for this Owner
Home Financials are based on the most recent Mortgage that was taken out on this home.
Original Mortgage
$216,000
Interest Rate
8.25%
Mortgage Type
Unknown
Create a Home Valuation Report for This Property
The Home Valuation Report is an in-depth analysis detailing your home's value as well as a comparison with similar homes in the area
Home Values in the Area
Average Home Value in this Area
Purchase History
| Date | Buyer | Sale Price | Title Company |
|---|---|---|---|
| Burzycki Mark | $617,000 | Cti | |
| Flaherty Builders Incorporated | $225,000 | None Available | |
| Avenue Homes Ltd | $270,000 | Premier Title |
Source: Public Records
Mortgage History
| Date | Status | Borrower | Loan Amount |
|---|---|---|---|
| Open | Burzycki Mark | $350,000 | |
| Previous Owner | Avenue Homes Ltd | $216,000 |
Source: Public Records
Tax History Compared to Growth
Tax History
| Year | Tax Paid | Tax Assessment Tax Assessment Total Assessment is a certain percentage of the fair market value that is determined by local assessors to be the total taxable value of land and additions on the property. | Land | Improvement |
|---|---|---|---|---|
| 2024 | $18,535 | $71,126 | $9,900 | $61,226 |
| 2023 | $16,679 | $71,126 | $9,900 | $61,226 |
| 2022 | $16,679 | $53,665 | $8,712 | $44,953 |
| 2021 | $15,671 | $53,664 | $8,712 | $44,952 |
| 2020 | $15,234 | $53,664 | $8,712 | $44,952 |
| 2019 | $15,072 | $55,157 | $7,920 | $47,237 |
| 2018 | $14,571 | $55,157 | $7,920 | $47,237 |
| 2017 | $13,892 | $55,157 | $7,920 | $47,237 |
| 2016 | $16,409 | $56,881 | $6,732 | $50,149 |
| 2015 | $1,906 | $6,732 | $6,732 | $0 |
| 2014 | $1,866 | $6,732 | $6,732 | $0 |
| 2013 | $1,740 | $6,732 | $6,732 | $0 |
Source: Public Records
Map
Nearby Homes
- 12501 S 71st Ct
- 12332 S Richard Ave
- 7309 W Palos Ave
- 12646 S 69th Ct
- 12815 S Seneca Rd
- 7660 W 124th Place
- 12022 S 72nd Ct
- 12718 S 69th Ct
- 12722 S 69th Ct
- 12900 S Seneca Rd
- 6839 W 127th St
- 11950 S 73rd Ct
- 6840 W Evergreen Ave
- 12626 S London Ln Unit 2
- 11920 S 74th Ave
- 6711 W Shiawassie Dr
- 7327 W College Dr
- 12753 S Oak Park Ave
- 13064 S 71st Ave
- 1 Moorings Dr
- 12433 S 73rd Ave
- 12415 S 73rd Ave
- 12422 S 72nd Ct
- 12420 S 72nd Ct
- 12432 S 72nd Ct
- 12422 S 73rd Ave
- 12432 S 73rd Ave
- 12412 S 73rd Ave
- 12449 S 73rd Ave
- 12403 S 73rd Ave
- 12402 S 72nd Ct
- 12442 S 72nd Ct
- 12448 S 73rd Ave
- 12402 S 73rd Ave
- 12423 S 73rd Ct
- 12449 S 72nd Ct
- 12441 S 73rd Ct
- 12413 S 73rd Ct
- 12443 S 73rd Ct
- 7228 W 125th St