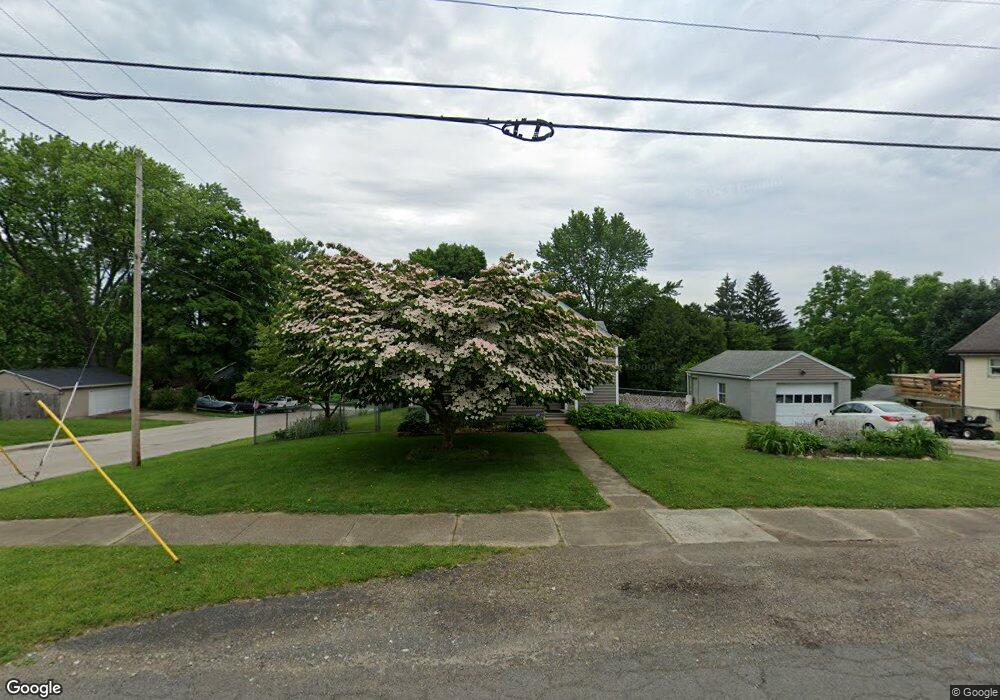
1243 Auburn Ave Barberton, OH 44203
Johnson's Corners NeighborhoodEstimated Value: $107,000 - $146,000
2
Beds
1
Bath
815
Sq Ft
$160/Sq Ft
Est. Value
About This Home
This home is located at 1243 Auburn Ave, Barberton, OH 44203 and is currently estimated at $130,153, approximately $159 per square foot. 1243 Auburn Ave is a home located in Summit County with nearby schools including Barberton Middle School, Barberton High School, and St Augustine Elementary School.
Ownership History
Date
Name
Owned For
Owner Type
Purchase Details
Closed on
Jun 26, 2012
Sold by
Tomich John F
Bought by
Nagy Andrea K
Current Estimated Value
Home Financials for this Owner
Home Financials are based on the most recent Mortgage that was taken out on this home.
Original Mortgage
$49,094
Outstanding Balance
$34,805
Interest Rate
4.25%
Mortgage Type
FHA
Estimated Equity
$95,348
Purchase Details
Closed on
Jun 15, 2007
Sold by
Whitney Linda J
Bought by
Tomich John F
Purchase Details
Closed on
Jul 8, 1996
Sold by
Wilken Carol A
Bought by
Tomich John and Tomich Linda
Home Financials for this Owner
Home Financials are based on the most recent Mortgage that was taken out on this home.
Original Mortgage
$65,450
Interest Rate
8.07%
Mortgage Type
New Conventional
Create a Home Valuation Report for This Property
The Home Valuation Report is an in-depth analysis detailing your home's value as well as a comparison with similar homes in the area
Home Values in the Area
Average Home Value in this Area
Purchase History
| Date | Buyer | Sale Price | Title Company |
|---|---|---|---|
| Nagy Andrea K | $50,000 | None Available | |
| Tomich John F | -- | None Available | |
| Tomich John | $67,500 | -- |
Source: Public Records
Mortgage History
| Date | Status | Borrower | Loan Amount |
|---|---|---|---|
| Open | Nagy Andrea K | $49,094 | |
| Previous Owner | Tomich John | $65,450 |
Source: Public Records
Tax History Compared to Growth
Tax History
| Year | Tax Paid | Tax Assessment Tax Assessment Total Assessment is a certain percentage of the fair market value that is determined by local assessors to be the total taxable value of land and additions on the property. | Land | Improvement |
|---|---|---|---|---|
| 2025 | $1,626 | $32,526 | $15,600 | $16,926 |
| 2024 | $1,626 | $32,526 | $15,600 | $16,926 |
| 2023 | $1,626 | $32,526 | $15,600 | $16,926 |
| 2022 | $1,667 | $28,928 | $11,386 | $17,542 |
| 2021 | $1,665 | $28,928 | $11,386 | $17,542 |
| 2020 | $1,303 | $23,130 | $6,990 | $16,140 |
| 2019 | $1,293 | $20,790 | $6,640 | $14,150 |
| 2018 | $1,273 | $20,790 | $6,640 | $14,150 |
| 2017 | $1,290 | $20,790 | $6,640 | $14,150 |
| 2016 | $1,293 | $20,790 | $6,640 | $14,150 |
| 2015 | $1,290 | $20,790 | $6,640 | $14,150 |
| 2014 | $1,283 | $20,790 | $6,640 | $14,150 |
| 2013 | $1,268 | $21,310 | $6,640 | $14,670 |
Source: Public Records
Map
Nearby Homes
- 21 29th St SW
- 32 29th St SW
- 1364 Wooster Rd W
- V/L Benton
- 207 28th St SW
- 1319 Stratford St
- 1361 Prospect St
- 1125 Prospect St
- 38 24th St NW
- 132 31st St SW
- 1450 Wooster Rd W
- 1084 Wooster Rd W
- 100 Meadow Ct
- 1030 Stratford St
- 139 24th St NW
- 000 Haynes Ave
- 4568 Krancz Dr
- 1080 Belleview Ave
- 243 27th St NW
- 3492 Johnson Rd
- 1243 Auburn Ave
- 1251 Auburn Ave
- 1233 Auburn Ave
- 1257 Auburn Ave
- 1252 Valley Ave
- 1229 Auburn Ave
- 1229 Auburn Ave
- 1261 Auburn Ave
- 1242 Auburn Ave
- 1238 Auburn Ave
- 1252 Auburn Ave
- 1234 Auburn Ave
- 1225 Auburn Ave
- 1258 Auburn Ave
- 1262 Valley Ave
- 1265 Auburn Ave
- 1260 Auburn Ave
- 1271 Auburn Ave
- 1224 Auburn Ave
- 1266 Auburn Ave